

Why Mastering Python for Data Analysis Accelerates Your Career
In 2026, the world runs on data, and jobs that deal with data are changing fast. It used to be enough to just know how to use basic tools. But now, companies want more. They need people who can truly understand big piles of information, find important patterns, and help make smart choices. This is where learning python for data analysis becomes super important.
Knowing Python is like having a superpower for anyone working with data.

It helps you clean up messy information, make cool charts, and even build smart programs that can learn from data. This makes you a much stronger team member, whether you’re starting out as a data analyst or aiming for a big promotion. Companies are always looking for skilled people, and knowing Python can open doors to exciting roles, even if you are looking for a data analyst remote position. It’s especially useful in fields like healthcare, where a healthcare data analyst might use it to study patient information or discover new trends.
Many guides agree that starting with Python basics is key to truly learning python for data analysis. This article will give you a clear map to help you master Python skills. We’ll start with the basics you need, then show you how to use these skills to get ahead in your career, whether you want to grow in your current job or switch to a new one. Get ready to boost your skills and your job prospects!
Staying on top of new tools and ideas in the data world is also a big part of growing your career.
The world of AI and data moves quickly, and it can be hard to keep up. Get clear daily AI updates from The AI Newsletter Worth Reading.
Why Data Science Skills Matter Now: Market Signals and Employer Needs
What does staying on top of new tools actually mean for your career? In 2026, it means understanding what companies really want. The demand for people who can work with data is huge and still growing. Jobs for data scientists are expected to grow by 34% from 2024 to 2034, which is much faster than most other jobs
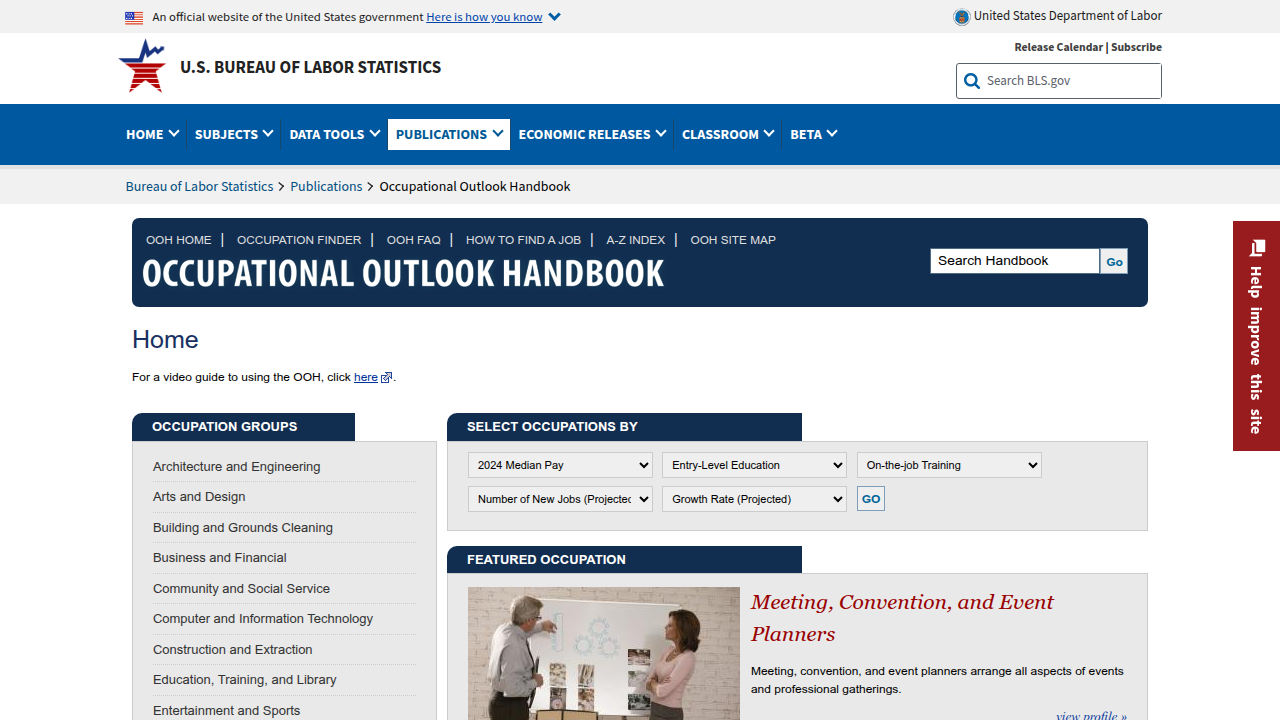
Data Scientists : Occupational Outlook Handbook. This growth shows that businesses deeply value people who can turn numbers into smart decisions.

When companies look for new hires, they have a clear list of skills they want. For anyone in a data role, whether it’s a data analyst or a data scientist, certain skills are a must-have. Python is at the top of this list. A lot of job ads, about 82% of them, mention Python as a key skill, making it almost impossible to get hired without it Breaking Into Data Science: Skills, Degrees and …. SQL, which helps you talk to databases, is also very important, showing up in about 55% of job postings.
Beyond these core programming skills, employers are also looking for people who understand how AI works. Many job postings, around 66%, now expect you to have some knowledge of AI AI + Data Scientist Job Market in 2026 (Update 2) | Andres …. This means knowing about machine learning and how to use it. If you’re looking for a good career step, focusing on these areas is smart. Learning about different types of Top Data Analysis Certifications 2026 for AI Professionals can also show employers you are serious about these important skills.
Think of data science skills as three big groups:
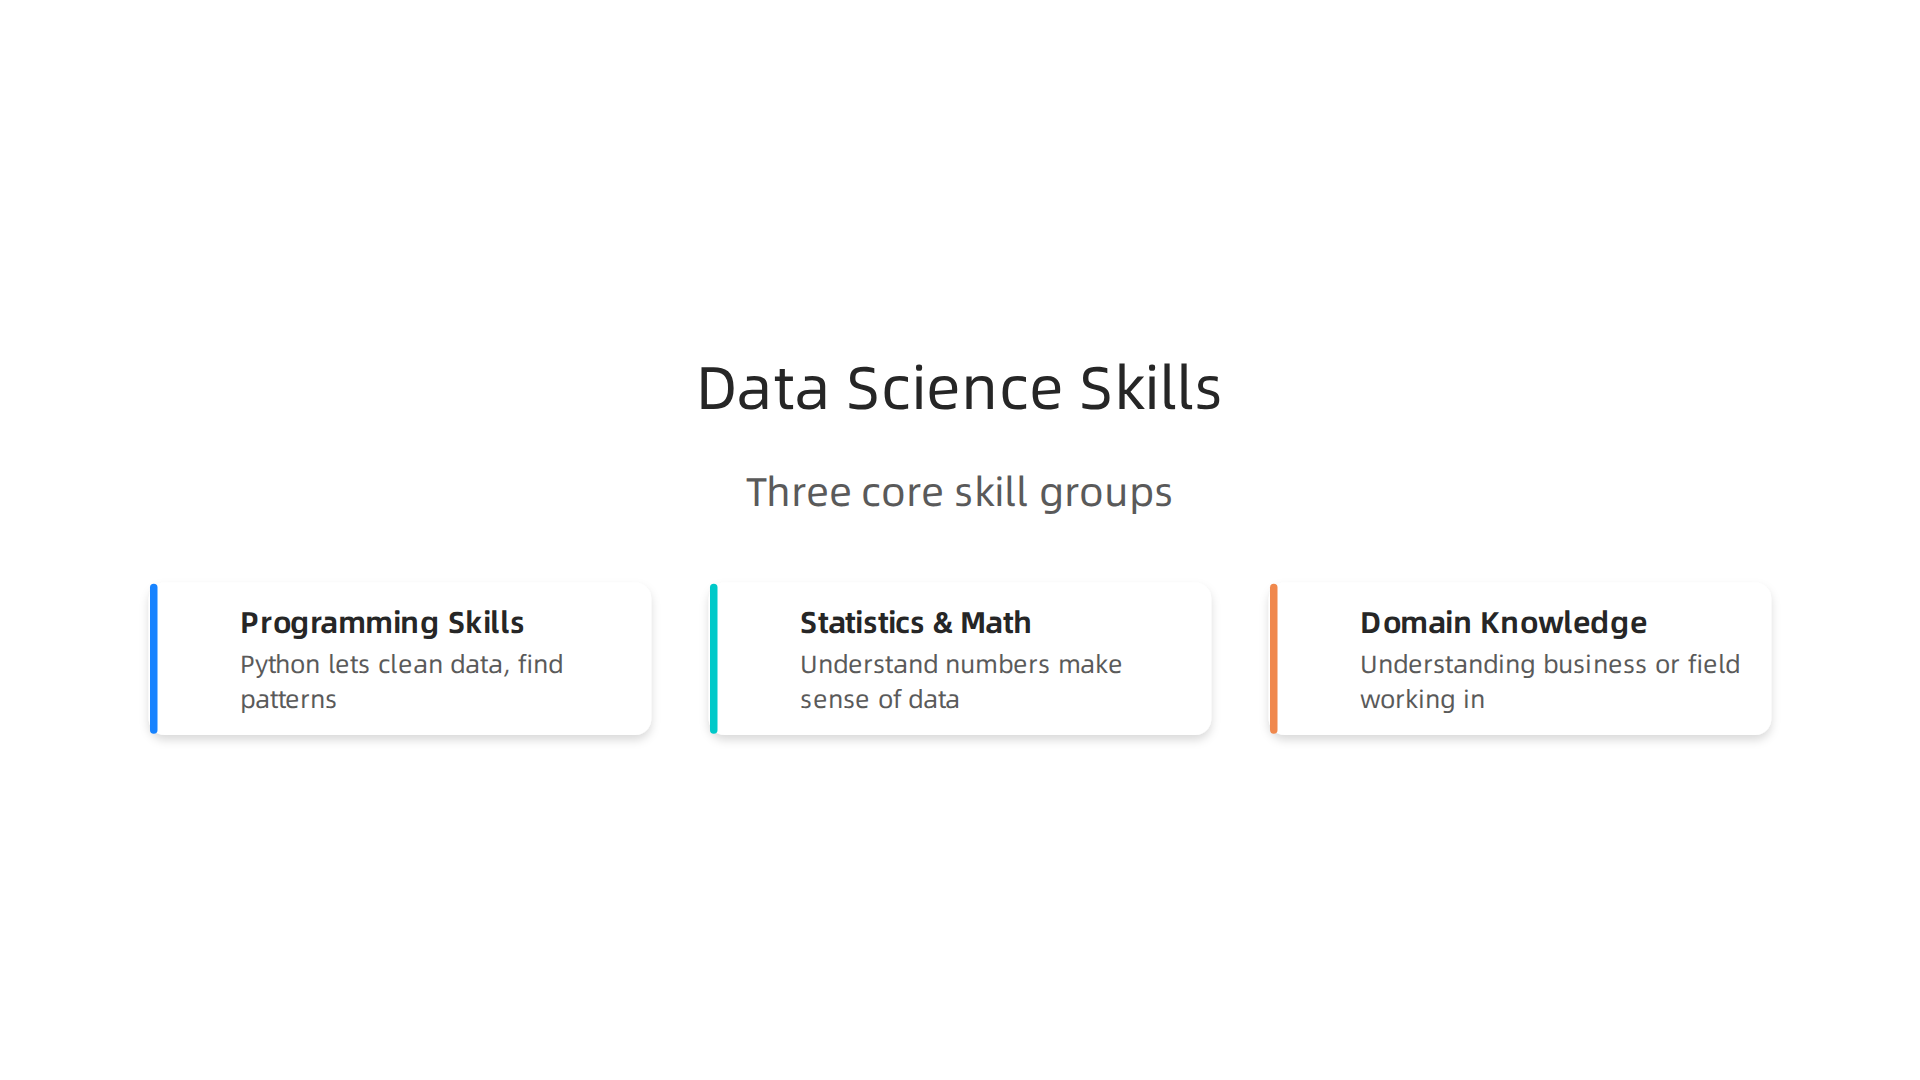
- Programming Skills: This is where python for data analysis shines. Python lets you clean data, find patterns, and build models. It’s the main tool for doing the actual work with data. Knowing Python also helps you use other tools and ideas in the field.
- Statistics and Math Skills: You need to understand numbers to make sense of your data. This helps you know if your findings are truly important or just random. Python has many tools to help with this, so you do not have to do all the complex math by hand.
- Domain Knowledge: This means understanding the business or field you are working in. If you are a healthcare data analyst, you need to know about healthcare. If you work in finance, you need to understand money matters. Python helps you bring your technical skills to solve real-world problems in that specific area.
Python is like the glue that holds these three parts together. It allows you to use your programming knowledge to apply statistical methods to your specific business problems. If you want to master the whole process, a good way to start is to get a better understanding of Your Guide to Mastering the Data Science Process.
To stand out, consider adding skills like taking an sql online course to make your resume even stronger. Employers are not just looking for one skill; they want people who can bring many different talents to the table and tackle complex data tasks.
Now that we know how important Python is for getting a data job in 2026, let’s look at what you actually need to learn. Mastering Python for data analysis means understanding its basic building blocks and the special tools it offers.
Essential Python Language Skills
Think of Python as a language. Just like any language, it has basic rules you need to know first.
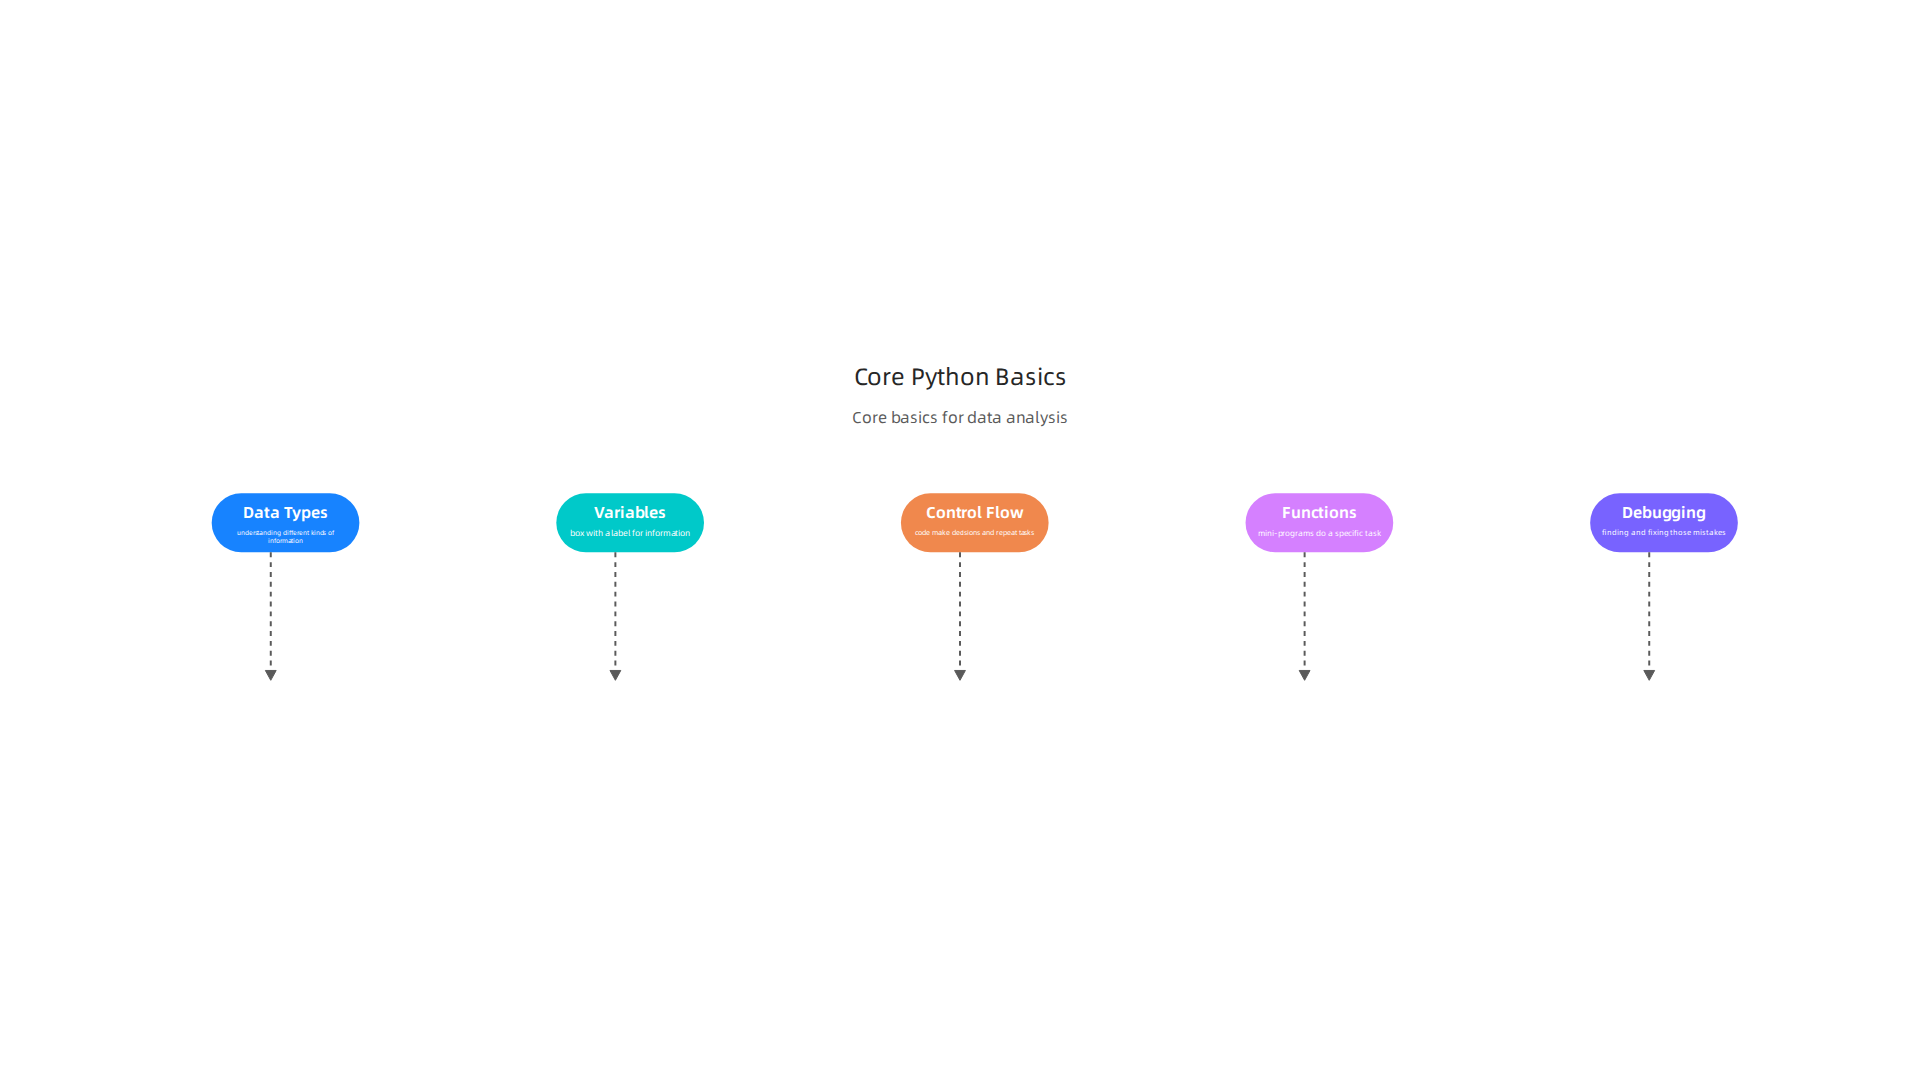
These are your core skills:
- Data Types: This is about understanding different kinds of information. Numbers (like 10 or 3.14), text (like "hello"), and true/false values are all handled differently by Python. You need to know how to work with each one.
- Variables: Imagine a variable as a box with a label. You put information into this box and give it a name so you can find it later. For example, you might have a box named
agethat holds the number30. - Control Flow (Loops and If-Statements): These let your code make decisions and repeat tasks. An "if-statement" lets your code do something only if a condition is true. A "loop" lets your code do the same thing many times, like checking every row in a big list of numbers.
- Functions: These are like mini-programs you write to do a specific task. If you often need to clean up data in the same way, you can write a function for it. This makes your code neat and easy to reuse.
- Debugging: This is like being a detective for your code. When your Python code doesn’t work as expected, debugging is the process of finding and fixing those mistakes. Learning to do this helps you solve problems much faster.
To get started with these basics, many free guides and videos can help. For example, some experts recommend starting with the fundamentals like basic syntax, variables, and data types when learning Python for Data Analytics Full Course 2026.
Core Libraries for Data Analysis
Once you know the Python basics, it’s time to learn about its special toolkits, called "libraries." These libraries are what make Python so powerful for data analysis.
-
Pandas: Your Smart Spreadsheet
Pandas is arguably the most important library for python for data analysis. It’s like a super-smart spreadsheet that works inside Python. Its main tool is called a DataFrame, which is a table with rows and columns, just like the data you might see in Excel.- What it does: Pandas helps you load data from different sources (like CSV files or databases), clean it up (for example, filling in missing values or removing duplicates), and get it ready for analysis. When you are looking to become a data analyst remote, mastering Pandas is a must for handling real-world datasets.
- How it helps: Imagine you’re a healthcare data analyst with patient records. Pandas can quickly help you find all patients in a certain age group or see how many records have missing information. Learning to use Pandas functions, like those that handle missing values or duplicates, can really speed up your work. This is a key best practice for effective data analysis, as highlighted in Python for Data Analysis: Tips, Tools, and Best Practices.
-
NumPy: For Number Crunching
NumPy is short for "Numerical Python." This library is all about working with numbers, especially in big lists or tables (called arrays).- What it does: NumPy makes complex math operations on large amounts of numbers very fast. Many other data science libraries, including Pandas, rely on NumPy behind the scenes.
- How it helps: If you need to perform calculations on entire columns of data at once, NumPy is your go-to. It’s often used for things like adding all numbers in a list or finding the average quickly.
-
Matplotlib and Seaborn: Drawing Pictures from Data
These two libraries are for making charts and graphs. Matplotlib is the older, more foundational one, and Seaborn builds on top of it to make even prettier and more complex charts easily.- What they do: They help you visualize your data. This means turning numbers into pictures like bar charts, line graphs, or scatter plots.
- How they help: Seeing your data in a picture can help you spot patterns, trends, and problems much faster than looking at raw numbers. For example, a sales chart over time can quickly show you if sales are going up or down. Visualizing data is a crucial step in any data analysis workflow, as noted in a guide on How to Learn Python for Data Science Fast in 2026.
Fitting into Analytical Workflows
These tools work together in a typical data analysis project. First, you use Pandas to load and clean your data. Then, you might use NumPy for any heavy number crunching. Finally, you use Matplotlib and Seaborn to visualize your findings. This whole process helps you understand your data and tell a story with it. A common workflow in 2026 involves steps like retrieving, cleaning, exploring, transforming, visualizing, and then explaining your data Python Data Analysis Guide (2026): Libraries & Workflow.
Staying informed about the latest tools and trends in AI and technology can give you an edge as you master Python for data analysis.
Get clear daily AI updates from The Deep View Newsletter. The AI Newsletter Worth Reading
Cleaning your data is a really important step in the data analysis journey. You might have all the right tools like Pandas and NumPy, but if your data is messy, your findings won’t be reliable. Think of it like cooking: even with the best ingredients and kitchen tools, you still need to wash your vegetables and chop them correctly for a good meal. This section will show you how Python helps with these common cleaning tasks and how to make your work run smoothly, even with very large datasets.
Data Wrangling & Cleaning with Python: Practical Techniques
Data wrangling is just a fancy way of saying you’re getting your data into shape. It involves cleaning, transforming, and organizing raw data so it’s ready for analysis. When doing python for data analysis, Pandas is your best friend for these tasks.
Here are some common cleaning steps:
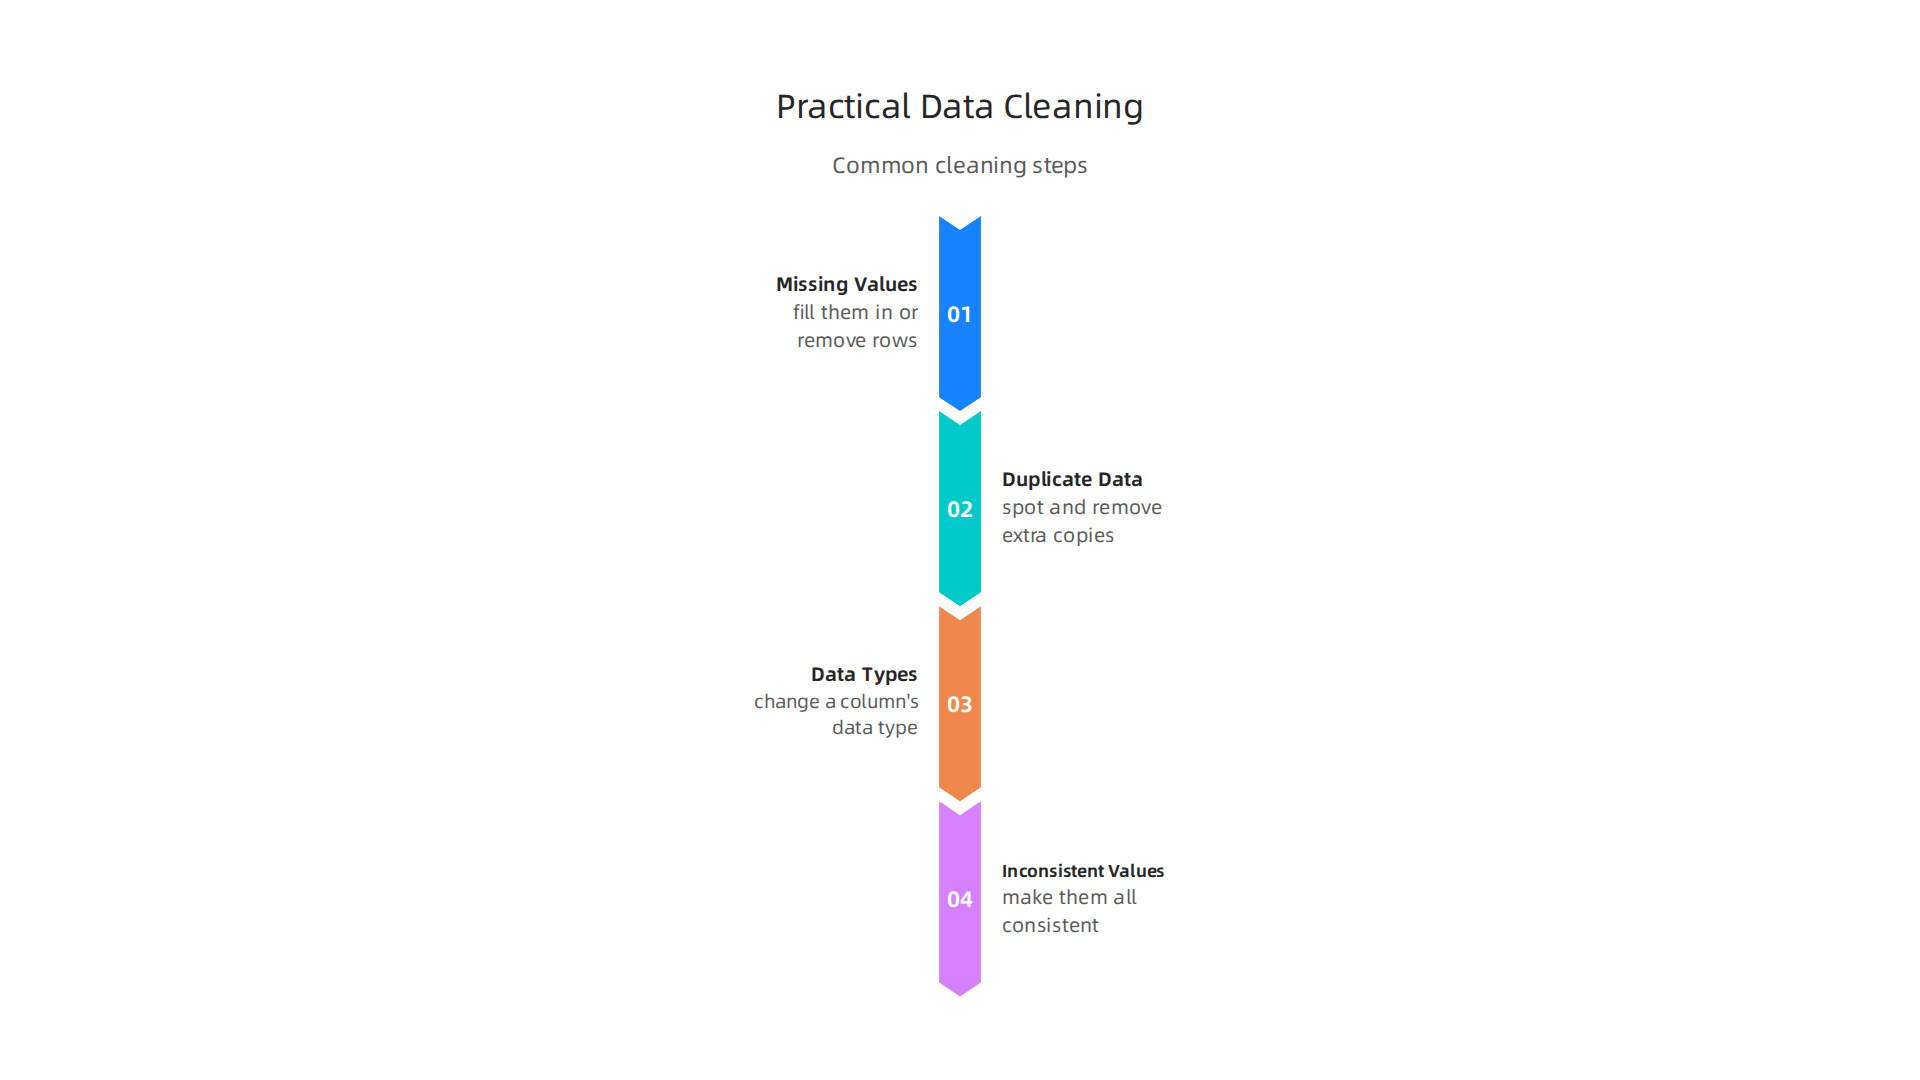
- Handling Missing Values: It’s common for datasets to have empty spots. Pandas has easy ways to deal with these. You can either fill them in with a sensible value (like the average) or remove the rows or columns that have too many missing entries. Using functions like
fillna()ordropna()helps you manage these gaps effectively. As data analysis experts point out, managing missing values is a key best practice for getting your data ready 1. - Removing Duplicate Data: Sometimes, you might have the exact same row of information listed more than once. This can mess up your analysis. Pandas can spot and remove these extra copies with functions like
drop_duplicates(), making sure each piece of information is counted only once. - Correcting Data Types: Data often comes in with the wrong type. For example, numbers might be stored as text, which means you can’t do math with them. Pandas lets you easily change a column’s data type so you can work with it properly.
- Fixing Inconsistent Formatting: Imagine you have a column for "Country" and some entries say "USA" while others say "United States." These are the same thing but spelled differently. You’ll learn how to make them all consistent so your analysis groups them together correctly.
These cleaning steps help you build a reproducible workflow. This means you write down your cleaning steps as code, so you can easily run them again on new data or share them with others. This makes your work consistent and easy to check, which is a major benefit of using python for data analysis.
Performance and Scaling for Big Data
Sometimes, your datasets are too large to fit neatly into your computer’s memory all at once. This is where you need smart strategies to keep your analysis fast and efficient. Here’s how to tackle large datasets using Python:
- Chunking Data: Instead of trying to load a giant file all at once, you can read it in smaller pieces, or "chunks." Pandas allows you to do this when you load a file, processing each chunk separately. This way, your computer doesn’t get overloaded 2.
- Memory-Efficient Data Types: By choosing the right data types, you can save a lot of memory. For example, if a column only contains small whole numbers, you don’t need to store it as a type that can hold huge numbers with decimals. Converting columns with repeated text values to "categorical" types can also greatly reduce memory use 3. You can also specify the data types when you first load the data to be more efficient 4.
- Vectorized Operations: Python libraries like Pandas and NumPy are built to be very fast when doing operations on whole columns or arrays at once. This is called "vectorization." It’s much faster than writing your own loops to go through data one item at a time 5. Aim to use these built-in vectorized functions whenever you can.
- Loading Only What You Need: If your dataset has many columns but you only need a few for your task, load only those important columns. This saves memory and speeds up the loading process 6.
By using these practical techniques, you can effectively prepare even very large and messy datasets for analysis. This focus on efficiency is important for any data analyst remote who might not have the most powerful computer but still needs to handle big data projects. Mastering these skills is a vital part of becoming proficient in python for data analysis.
1"Python for Data Analysis: Tips, Tools, and Best Practices," medium.com.
2"How to Handle Large Data Processing with Pandas," onetimereport.com.
3"Mastering Pandas Efficiency: A Hands-On Engineering Guide," medium.com.
4"7 Pandas Performance Tricks Every Data Scientist Should Know," towardsdatascience.com.
5"Working with Pandas DataFrames: A Practical Guide & Best Practices," motherduck.com.
6"Seven Killer Memory Optimization Techniques Every Pandas User Should Know," towardsdatascience.com.
Now that you know how to clean and prepare your data, the next exciting step in python for data analysis is to use it for making smart predictions. This is where machine learning comes in. Think of it like teaching a computer to learn from past information so it can guess what might happen in the future.
Applying machine learning basics with Python: models, evaluation, and pipelines
Machine learning helps us turn our clean data into tools that can predict things. Maybe you want to predict if a customer will buy a product, or if a patient in healthcare data analyst records is likely to develop a certain illness. Python has a special toolkit called scikit-learn that makes building these predictive models much easier. Many people learning python for data analysis will explore scikit-learn after mastering the basics of Python, Pandas, and NumPy. If you’re looking to dive deeper into these skills, a full course on data analytics with Python can be very helpful, as it often includes machine learning basics as well Python For Data Analytics Full Course 2026.
Here’s how it generally works:
- Building Predictive Models: You feed your cleaned data into a
scikit-learnmodel. This model then looks for patterns. For example, a model might learn that customers who bought item A and item B often also buy item C. There are different types of models for different tasks. Some models help you put data into groups, like sorting emails into "spam" or "not spam." Other models help you predict a number, like the future price of a house. - Evaluation Metrics: After building a model, how do you know if it’s any good? We use "evaluation metrics" to check its performance. It’s like a report card for your model. For grouping tasks, you might check its "accuracy" to see how many things it sorted correctly. For number-predicting tasks, you might see how close its guesses were to the actual numbers. Learning how to properly evaluate your models is a key part of the data science process Your Guide to Mastering the Data Science Process.
Putting Models into Reproducible Pipelines
Just like cooking, you want a recipe that works every time. In data analysis, this means creating a "pipeline" for your machine learning models. A pipeline is like a set of clear, step-by-step instructions that ensure your model is built and tested in a fair way, and can be used again and again.
- Train/Test Splits: Imagine you’re studying for a test. You wouldn’t use the exact same questions from your study guide on the actual exam, right? That wouldn’t tell you what you really learned. It’s the same with models. We split our data into two parts:
- Training Data: This is the bigger part, used to teach the model.
- Test Data: This is a smaller, hidden part, used to see how well the model performs on new data it has never seen before. This helps prevent the model from just memorizing the training data without truly understanding the patterns.
- Cross-Validation: Sometimes, a single train/test split might not give you the full picture. Cross-validation is a smarter way to test your model. It involves splitting your data into several different train and test sets, running the model many times, and then averaging the results. This gives you a more reliable idea of how well your model will do in the real world. Using best practices like cross-validation helps ensure your
python for data analysisprojects are sound Python Best Practices 2026. - Deployment Prep: Once you have a model that you’re happy with, the next step is to get it ready for use. This means turning it into something that can actually make predictions in a real-world system, like on a website or in an app. This step is sometimes called "deployment." Building strong
python for data analysisskills, including basic machine learning, can open doors to many exciting roles, even for those working as a data analyst remote. Knowing how to prepare models for use is a key skill for any aspiringdata analyst.
Understanding these machine learning basics will help you not just analyze data, but also build tools that can predict and help make better decisions. To stay on top of all the new tools and changes in the world of AI, which is closely linked to machine learning and data analysis, consider subscribing to a dedicated newsletter.
Get clear daily AI updates from The AI Newsletter Worth Reading.
Great analysis in python for data analysis is only part of the journey. What good is a brilliant insight if you can’t share it with others in a way they understand? This is where soft skills come into play. They help you turn your hard work into real-world impact.
Presenting Analysis to Non-Technical People
Imagine you’ve used your python for data analysis skills to find something amazing in the data. Now you need to tell someone who doesn’t know about code or complex models. This is often a business leader or a team member who just needs to understand the "what" and "why," not the "how."
Here’s how to make your analysis land:
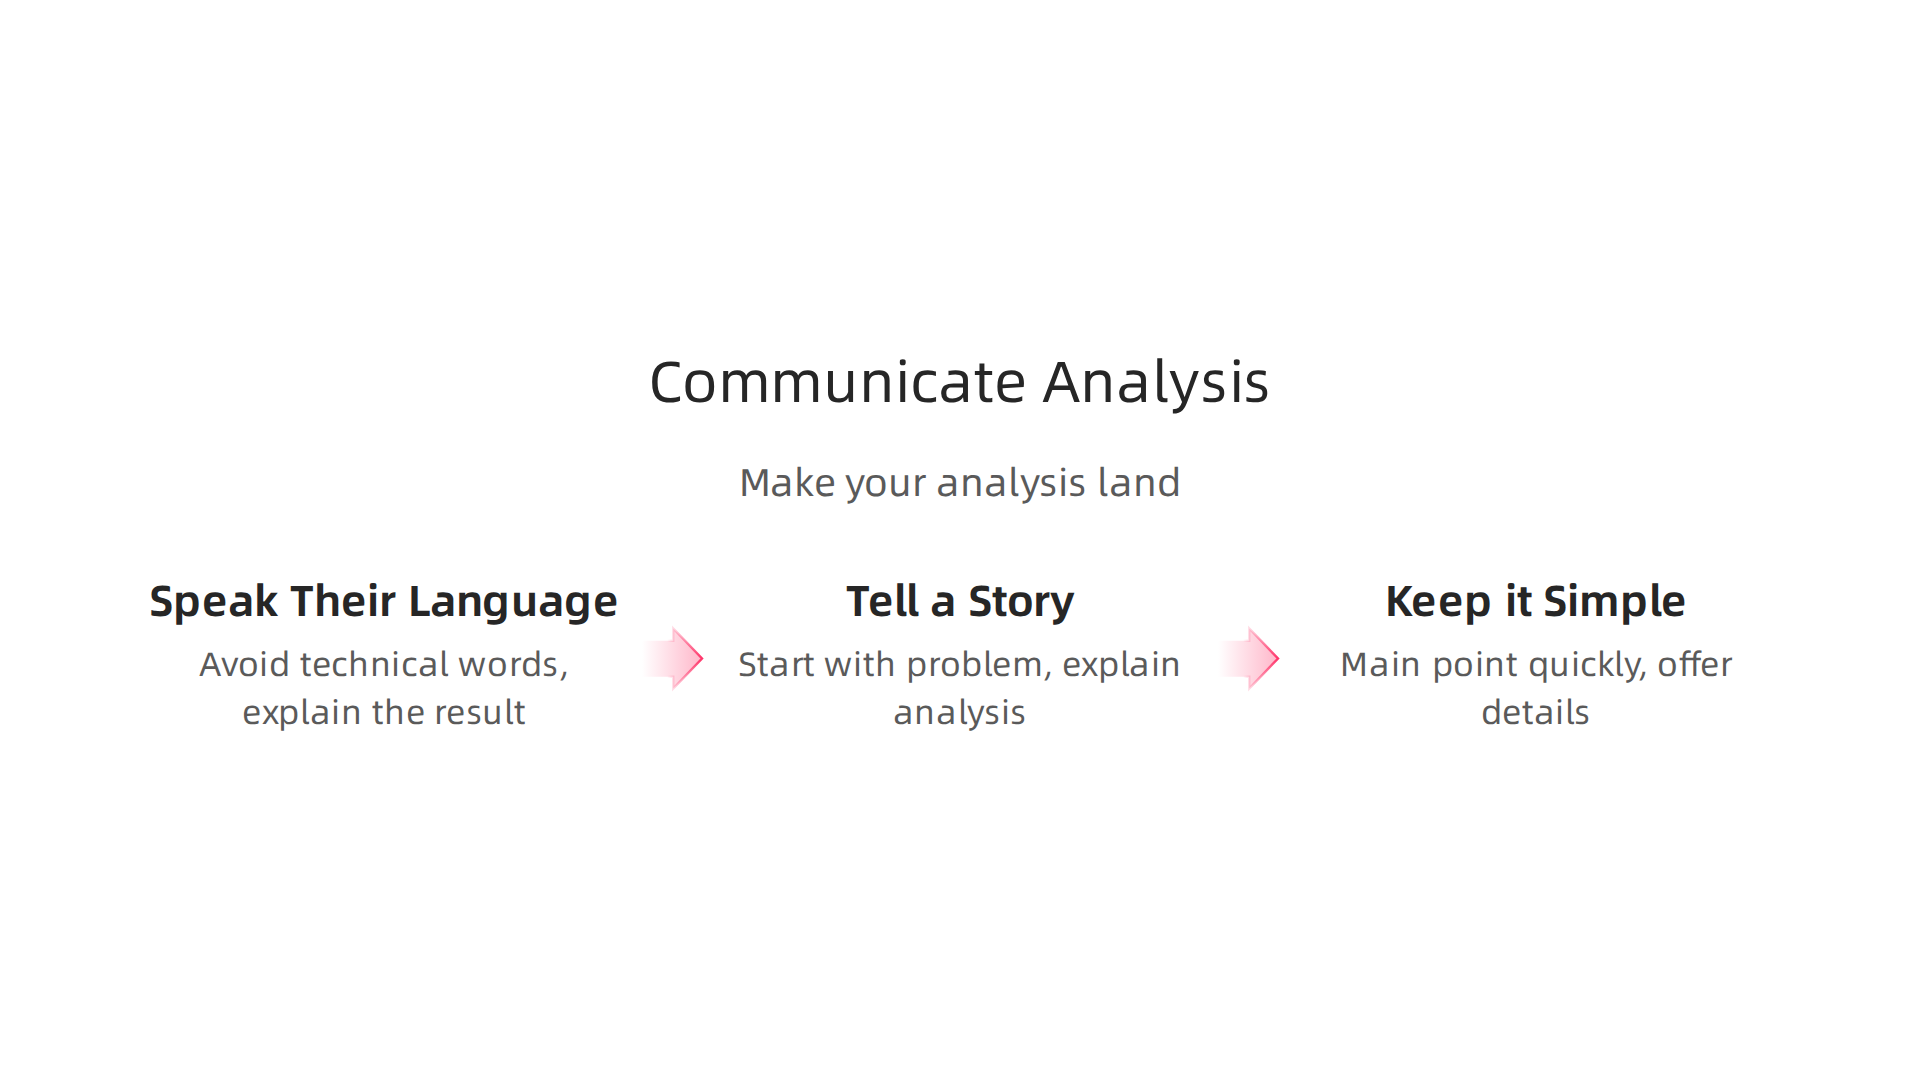
- Speak Their Language: Avoid technical words. Instead of talking about "gradient boosting algorithms," explain the result clearly, like "our prediction model got 90% accuracy." Think about what matters most to your audience. According to experts, clear communication ensures that your smart findings can actually be used to make better decisions and help the team work together effectively Key Soft Skills for Data Analysts.
- Tell a Story with Data: People remember stories better than raw numbers. Start with the problem, explain how your analysis helped, and end with what actions they can take. Use charts and graphs to show your findings instead of just text. This "data storytelling" is a key part of communication skills for data professionals The Toolset of a Data Analyst: Key Soft Skills Gained From ….
- Keep it Simple: Get to the main point quickly. The "TL;DR" (Too Long; Didn’t Read) approach can be very helpful. This means giving the most important information first, then offering more details if people want them. Simplifying complex ideas is a skill that any data analyst needs to master Communication Skills for Data Science.
Working Well with Others: Collaboration Skills
Being a data analyst often means working with many different people: other analysts, engineers, product managers, and business teams. Good teamwork skills make sure everyone is on the same page.
- Version Control (like Git): This is like a "save history" for your code and notebooks. If you’re doing
python for data analysiswith a team, Git helps everyone work on the same project without messing up each other’s changes. It also lets you go back to older versions if something goes wrong. This is a must-have skill for modern development. - Reproducible Notebooks: When you share your analysis, others should be able to run your code and get the exact same results. This means making your notebooks clear, organized, and complete with all the steps. This ensures trust and makes future work easier.
- Working with Engineering Teams: Sometimes, your analysis might lead to a new feature or tool. You’ll need to explain your findings to engineers so they can build it. Understanding their goals and setting clear timelines can make these hand-offs much smoother, which is important for any data role How to Collaborate in Data Roles | Soft Skills in Tech. Strong collaboration skills help data analytics professionals work together towards shared goals The Five C’s: Soft Skills That Every Data Analytics Professional Should Have.
Mastering these soft skills is just as important as your technical abilities for a successful career. They are key to transforming data insights into actions that help a company grow. If you’re aiming for a role like a data analyst remote, these collaboration and communication skills are even more important for staying connected with your team. To further your understanding of a data analyst’s career path and necessary skills, you can explore resources like those about entry-level data analyst jobs in 2026. Many resources also delve into what it takes to climb the ladder in AI-related positions, covering mastering AI jobs 2026 and essential learning paths.
Beyond technical know-how and soft skills, building a successful career in data means showing what you can do. This is where a strong portfolio, smart interview prep, and clear growth plans come in handy. They help you turn your skills, like using python for data analysis, into a clear path for your future.
Building a Career Path: Portfolios, Interviews, and Growth Strategies
To truly stand out, you need to show off your skills.

This means creating projects that highlight how you use tools like python for data analysis to solve real business problems.
Create a Strong Portfolio of Projects
Your portfolio is your story. It shows potential employers what you can actually do. Don’t just list skills; show them in action.
- Solve Real Problems: Instead of simple practice exercises, pick projects that answer real questions or fix actual issues. For example, if you’re interested in being a
healthcare data analyst, you could analyze patient data to find trends or improve hospital efficiency. Use publicly available datasets or create your own if possible. - Show Your
Python for Data AnalysisSkills: For each project, clearly show how you used Python. Did you clean messy data with Pandas? Did you make insightful charts with Matplotlib or Seaborn? Explain your steps and why you chose certain methods. In 2026, Python is a must-have, appearing in over 80% of data science job postings, making it a key skill to showcase Data Science Jobs in 2026: Pay, Demand and Hiring. - Highlight Business Impact: For each project, explain what you learned and what actions someone could take based on your findings. Did your analysis save money? Did it help understand customers better? This shows you think beyond just the numbers.
- Include SQL Expertise: Alongside Python, SQL is another core skill employers look for. It appeared in 79% of data scientist job postings in 2026, showing its high demand The Data Scientist Skill Bar Just Moved. New Posting …. If you’ve taken a
sql online course, add projects that show your ability to work with databases.
Prepare for Different Data Roles
The world of data has many exciting paths. While a data analyst focuses on understanding past data, a data scientist often builds models to predict the future, and an ML engineer focuses on putting those models into action.
- Data Analyst: These roles often require strong SQL skills, data cleaning, visualization, and the ability to explain findings clearly. You’ll likely answer "what happened?" and "why?"
- Data Scientist: In 2026, data scientists are highly sought after. They need solid programming skills, especially
python for data analysis, machine learning knowledge, and a strong understanding of statistics. About 78% of data scientist jobs in 2024 and 57% in 2025 mentioned Python, while machine learning appeared in 69% of postings Data Scientist Job Market 2026: Analysis, Trends …. Many roles also look for AI capabilities, with 66% of all postings expecting some level of AI knowledge AI + Data Scientist Job Market in 2026 (Update 2) | Andres …. - Machine Learning Engineer: These roles are more about software engineering and deploying AI models. They need deep programming skills, knowledge of cloud platforms, and experience with machine learning frameworks.
When preparing for interviews, tailor your stories and projects to the specific role you want. Know the differences and show how your skills fit. To learn more about what a data analyst does and how to get started, check out this What is a Data Analyst Your 2026 Career Guide.
Continuous Growth and Learning
The tech world changes fast, especially in data and AI. To stay ahead, you need to keep learning.
- Stay Updated with AI Trends: New AI models, tools, and research come out all the time. Being aware of these changes is important for any data professional.
- Consider Certifications: Look into certifications that can boost your resume. There are many great Top Data Analysis Certifications 2026 for AI Professionals that can show you have specialized knowledge.
- Network with Others: Connect with other data professionals. Share ideas, learn from their experiences, and find out about new opportunities, including
data analyst remotepositions.
Keeping up with the latest in artificial intelligence and technology is key to career growth. Stay informed with valuable daily insights:
The AI Newsletter Worth Reading
Summary
This article explains why mastering Python for data analysis is a fast path to career growth in 2026 and maps a practical learning route from fundamentals to real-world impact. It covers market signals that make Python essential, the core language skills to learn, and the most important libraries—Pandas, NumPy, Matplotlib/Seaborn and scikit-learn—for cleaning, visualizing, and modeling data. You’ll get concrete advice on data wrangling, handling large datasets (chunking, memory-efficient types, vectorized operations), and building reproducible ML pipelines with proper evaluation. The piece also stresses soft skills—clear communication, storytelling, version control, and teamwork—and shows how to present projects that demonstrate business value. Finally, it walks through career steps: building a portfolio, tailoring interview stories for analyst versus scientist roles, and continuous learning strategies to stay competitive in an AI-driven job market.