

Why learn data science from scratch? A concise roadmap for beginners
Have you ever wondered about the power of data, but felt lost trying to understand it? Many busy professionals want to learn data science from scratch but don’t know where to start. It can feel like you need a math degree or years of coding experience just to begin. Actually, learning data science means building up all the necessary skills step-by-step, no matter your starting point. It’s about taking a clear, structured path to understand how to make sense of information.

In 2026, data science is a huge field that covers many exciting areas. It’s not just about numbers; it’s about finding stories and answers in data. A typical data science program might include core topics like programming, statistics, how to prepare data, and machine learning. These are the building blocks you will learn from the ground up, moving from simple ideas to more complex ones.
Learning data science this way is smart because it gives you a strong foundation. You won’t just memorize things; you’ll truly understand them. This helps you grasp important ideas like what is data analytics and how to do data modeling without getting overwhelmed.
Common Hurdles for New Learners
Starting something new always has its challenges. When you’re trying to learn data science from scratch, you might worry about a few things:
- Math gaps: Maybe it’s been a while since you thought about algebra or statistics. Don’t worry, a good roadmap will show you just the math you need, in simple ways.
- Tool selection: There are so many coding languages and programs out there. Which ones should you learn first? We will help you pick the right tools that make sense for beginners.
- Project selection: How do you get real-world experience without a job? We’ll guide you to find projects that help you practice and build your skills.
Many people also struggle with choosing the right learning materials. There are countless online analytics courses and tutorials. Our goal is to cut through the noise and give you a clear plan.
Your Path to Data Science Success
This guide is designed for professionals like you who want a practical way to learn data science. By following our concise roadmap, you will gain:
- A prioritized learning plan: We’ll show you what to learn first, second, and so on. This way, you build skills in the right order.
- Essential tools: You’ll discover the key software and programming languages that data scientists use every day.
- First projects: You’ll learn how to start your own projects, helping you put what you learn into practice and build a portfolio.
By the end, you’ll have a clear understanding of the data science process, from asking the right questions to sharing your findings. For instance, a full data science syllabus in 2026 often spans core modules like Python, SQL, statistics, data wrangling, and even machine learning, showing you the breadth of skills you can master when you approach it step-by-step Data Science Syllabus 2026: Full Module Breakdown – Tutorac.

If you’re ready to dive in and master the core steps, check out Your guide to mastering the data science process for more details.
Staying informed about the latest trends in AI and technology can also boost your learning journey.
Get clear daily AI updates from The AI Newsletter Worth Reading.

What is Data Science? Roles, Workflows, and Career Paths
Since staying updated on AI and technology is so important, let’s look closer at what data science actually is. Data science is like being a detective for information. You use special tools and smart thinking to find hidden clues and answers in large amounts of data. This helps people and businesses make better choices.

In 2026, data science blends computer skills, math, and understanding different industries to solve real problems.
Learning data science from scratch means you’ll dive into subjects like programming, statistics, and how to use computers to learn from data. The main subjects you’ll study in a data science course often include statistics, programming, machine learning, and how to show data clearly Top Core Subjects You’ll Study in a Data Science Course (2026 …).

Data Science vs. Other Roles
It’s easy to mix up data science with other jobs that also work with data. Here’s a simple way to see the differences:
- Data Scientist: This is the big picture thinker. They find out what problems need solving, then collect and clean data. They build models to predict what might happen in the future and explain what the data means.
- Data Analyst: If you’re wondering what is data analytics, think about looking at past information. Data analysts focus on understanding what has already happened. They create charts and reports to show trends and patterns, helping people understand their current situation. If you’re interested in this path, you can explore a dedicated guide for this role with the What is a data analyst? Your 2026 career guide.
- Data Engineer: These are the builders. They set up and maintain the systems that gather, store, and get data ready. They make sure data flows smoothly so data analysts and scientists can use it.
- Machine Learning Engineer: These folks take the smart models built by data scientists and make them work in real products or systems. They focus on making sure the models run fast and reliably.
The Data Science Workflow: A Step-by-Step Approach
No matter if you’re learning data science from scratch or are already working in the field, the process usually follows these steps:
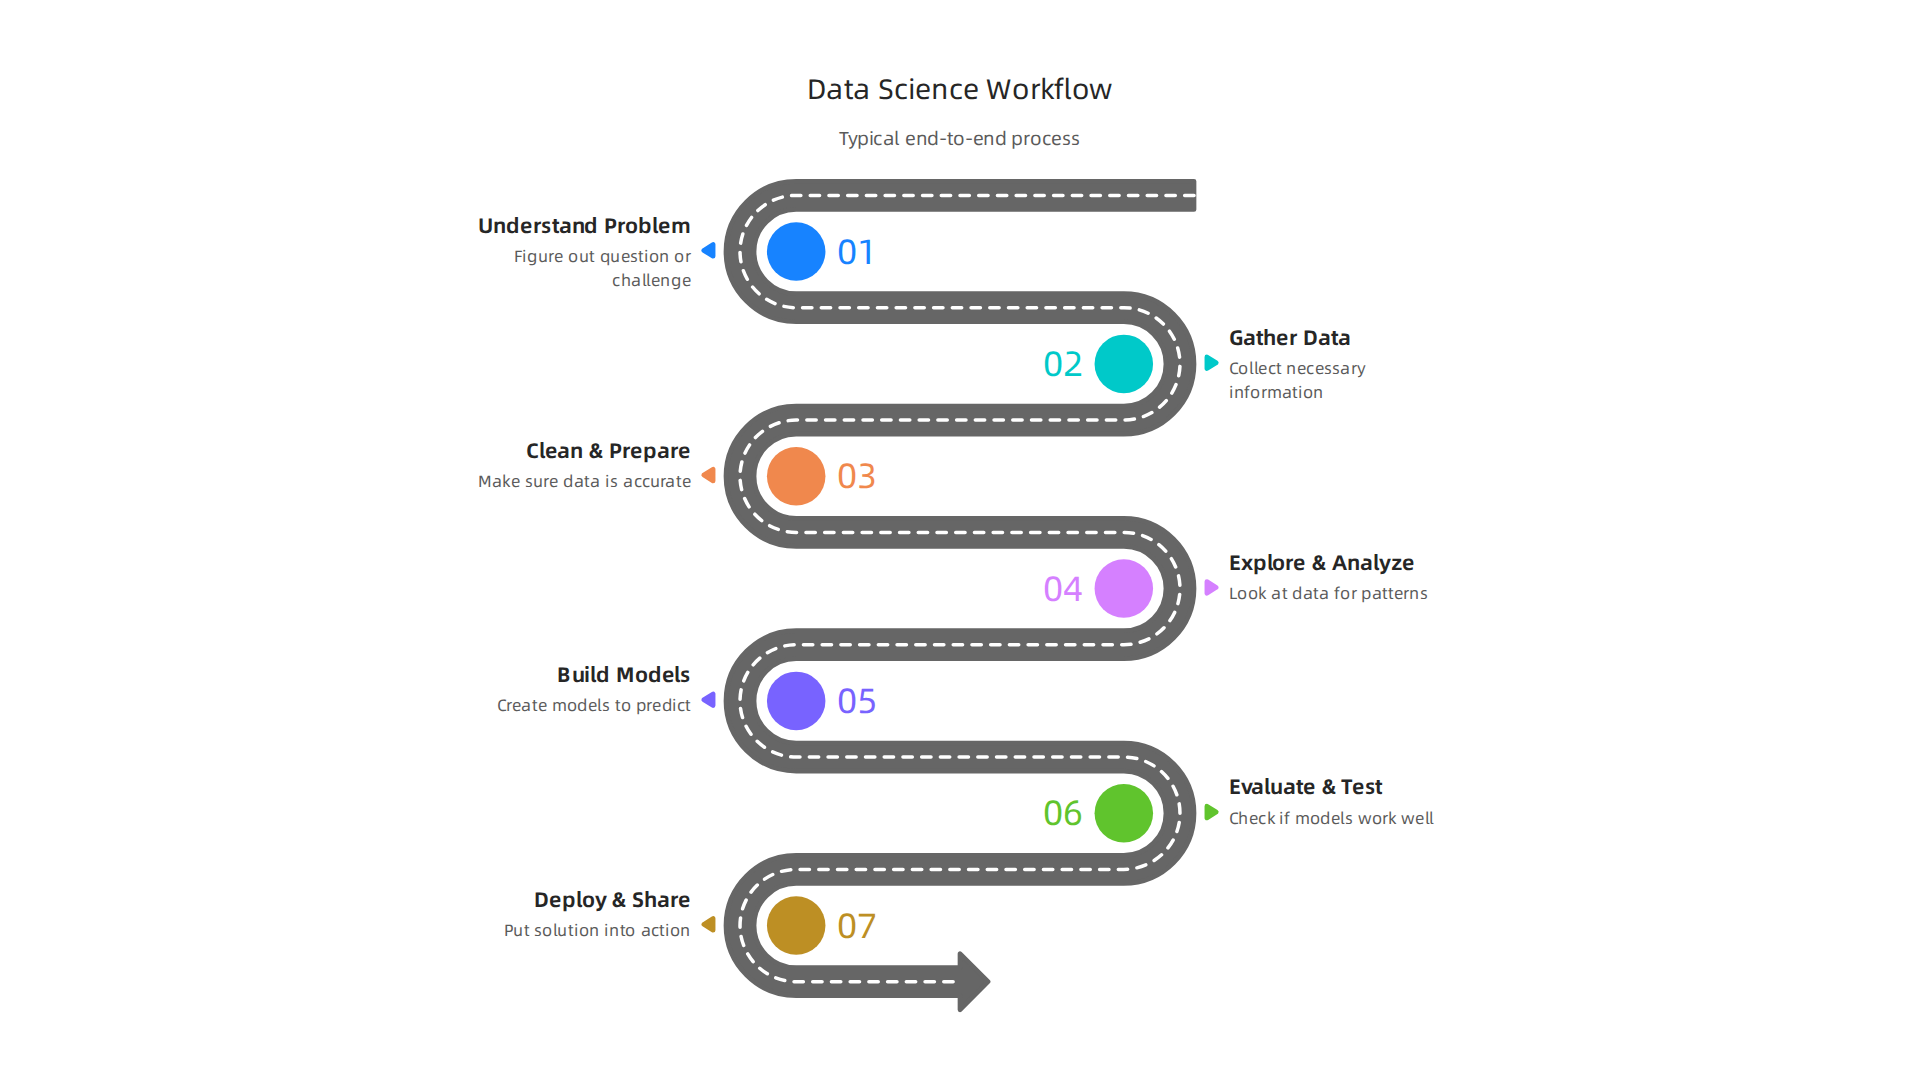
- Understand the Problem: First, you figure out what question you need to answer or what challenge you’re trying to fix.
- Gather Data: You collect all the necessary information from different places.
- Clean and Prepare Data: This is a big part of the job. You make sure the data is accurate, complete, and in the right format. This step is super important for good results.
- Explore and Analyze: You look at the data to find patterns, averages, and interesting insights. This is a core part of what is data analytics.
- Build Models (Data Modeling): You use math and computer programs to create models. These models can help predict things, group similar items, or find special connections. This skill is known as data modeling.
- Evaluate and Test: You check if your models work well and are giving good answers.
- Deploy and Share: Finally, you put your solution into action and share your findings with others so they can use the insights.
Your Career Path in Data Science
Starting a career in data science can feel big, but there are many ways to begin. Many people start as data analysts, building a strong base in understanding data before moving on to more complex tasks like building advanced models. You can also specialize early in areas like machine learning if that’s what excites you most.
Choosing a path that fits your goals is key. As you learn data science from scratch, you’ll find out which part of the data world you enjoy the most. From there, you can grow into different roles and even master various AI jobs 2026 with in-demand skills and high salaries. The important thing is to take that first step and keep learning.
To take that first step in learning data science from scratch, it’s smart to begin with tools that give you a lot of power without being too hard to learn. Think of it like building a house: you need a good hammer and some strong nails before you worry about fancy power tools. For data science, this means picking one main programming language, a place to do your work, and some key add-on tools.
Essential Languages: Python vs. R
When you’re starting out, you’ll mainly hear about two programming languages: Python and R.
- Python: This is often seen as the most helpful tool for data science. It’s popular because it’s easy to read and can do many things, from cleaning data to building smart models that learn Top 10 Data Science Tools in 2026.

In 2026, Python is still the go-to language for many data scientists and is especially strong for machine learning and AI Python in Data Science and AI 2026: The Dominant Language for …. About half of Python developers use it for exploring and working with data 46 Python Statistics for 2026: Usage, Jobs & AI Trends – Pynions.
- R: R is another great choice, especially if you’re very focused on numbers, statistics, and making nice charts to show what your data means. It was made specifically for these kinds of tasks.
Many experts suggest learning Python first because it’s so widely used and has many easy-to-use libraries, which are like toolkits that help you do complex tasks with just a few lines of code.
Key Libraries and Tools
Once you pick a language like Python, you’ll want to learn some important libraries.
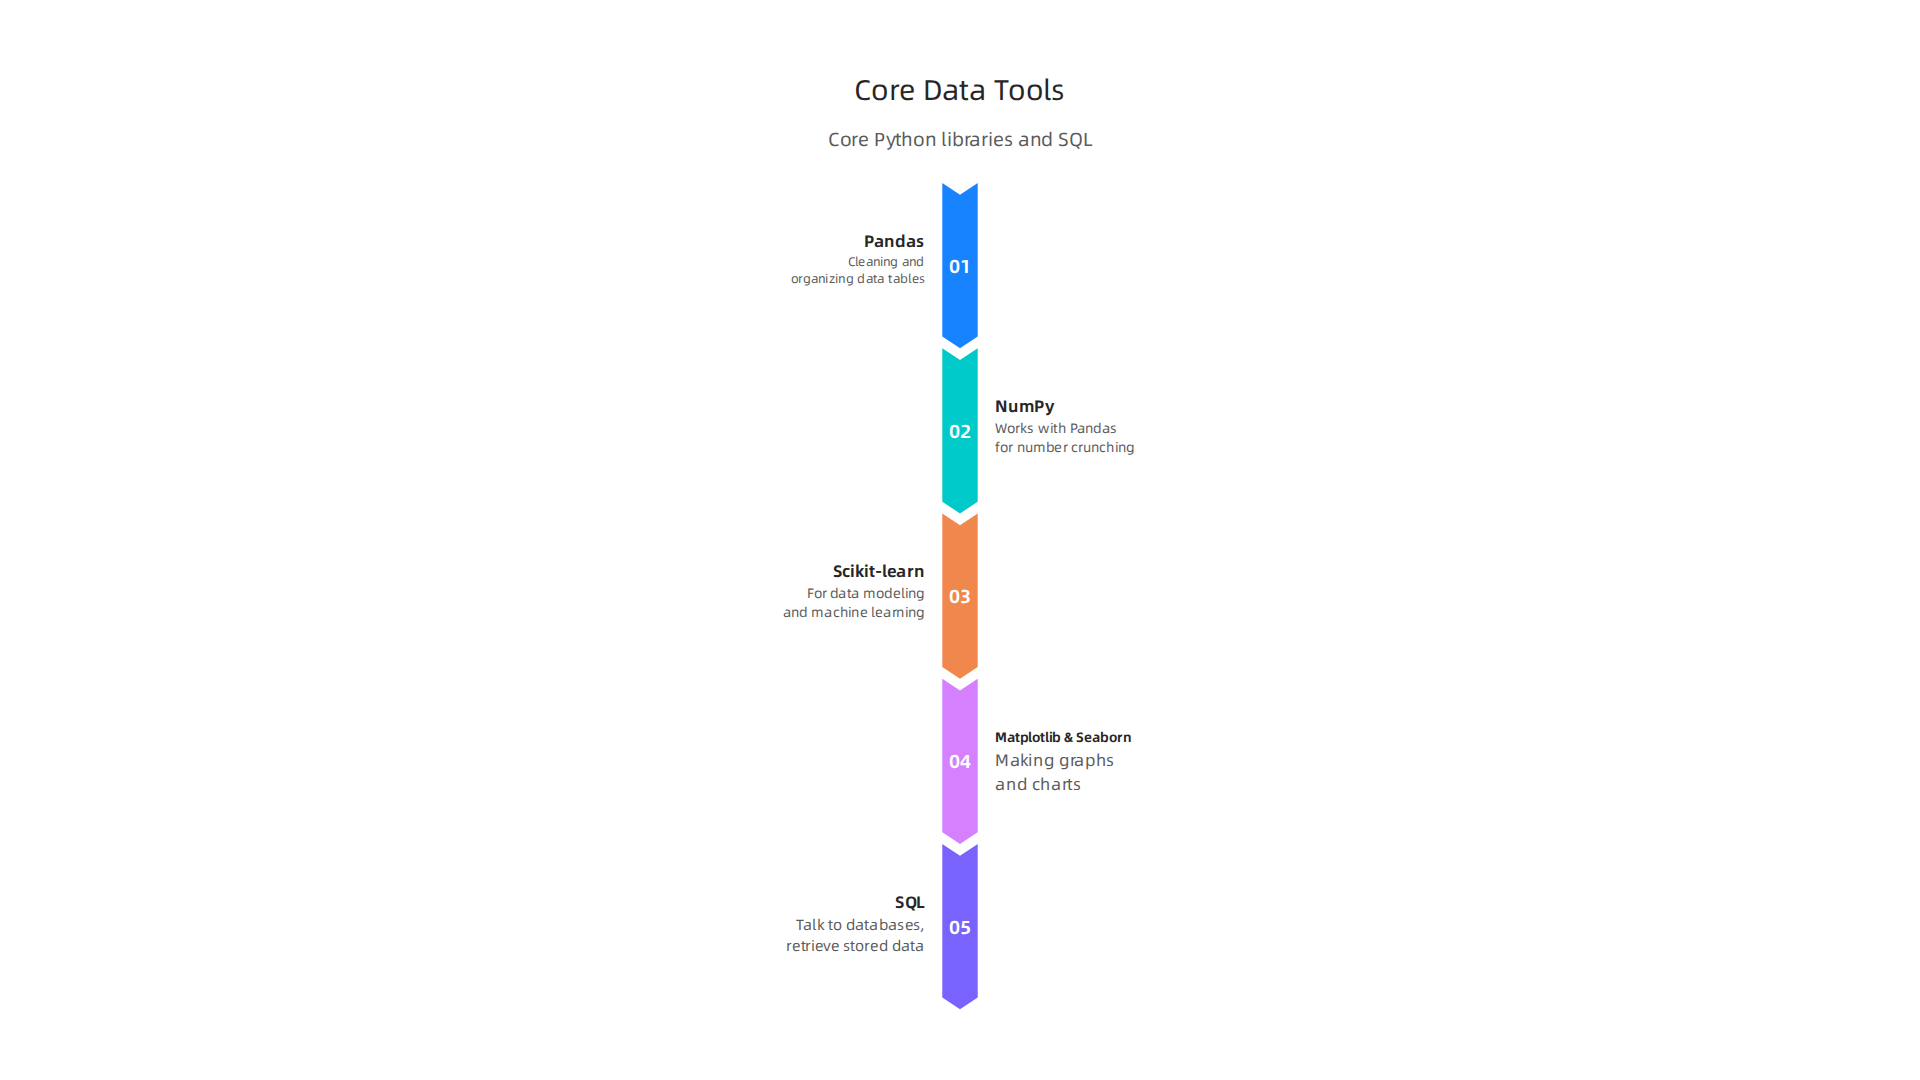
These are pre-made sets of tools that make your work much easier:
- Pandas: This is a must-have for cleaning and organizing your data. It helps you handle data tables quickly.
- NumPy: Works hand-in-hand with Pandas for number crunching.
- Scikit-learn: This library is fantastic for data modeling and machine learning. It helps you build predictive models.
- Matplotlib and Seaborn: These are for making great-looking graphs and charts so you can visualize your data, which is a big part of what is data analytics.
- SQL (Structured Query Language): Even though it’s not a programming language like Python, SQL is super important. It’s the language you use to talk to databases, where a lot of the world’s data is stored. Learning SQL is a foundational skill for any data role.
Your Work Environment: Where to Code
To write and run your code, you’ll use specific environments:
- Jupyter Notebooks: These are very popular for data science. They let you write code, add notes, and see your results (like charts) all in one place. They’re great for learning and sharing your work.
- VS Code (Visual Studio Code): A powerful text editor that can be set up for many languages, including Python and R. It offers more features for writing longer programs.
- RStudio: If you choose R, RStudio is the best place to work. It’s an all-in-one environment designed for R.
Many of these environments can be run on your own computer (local setup) or through online services (cloud setup). For experiments and work you want to share, cloud-based notebooks can be very handy.
Learning these core tools forms a strong base. It helps you understand not just what is data analytics, but also how to actually do the work. Remember, the world of AI and data moves fast. Getting clear updates daily can make a big difference in staying ahead.
The AI Newsletter Worth Reading
Moving beyond the coding tools, truly understanding data science from scratch also means getting a good grip on some key math and statistics ideas. Think of it like cooking: you have your pots and pans (the tools), but you also need to know about flavors and measurements (math and stats) to make a great dish. These ideas help you understand why the tools work and what the data is really telling you.
Why Math and Statistics Are Your Data Science Superpowers
In data science, you’re always working with numbers and patterns. Math and statistics give you the language to talk about these patterns clearly and make smart guesses about the future. For instance, when you’re looking at what is data analytics, you’re often using statistical thinking to find meaning in big piles of information. These skills are so important that many data science jobs list them as non-negotiable, foundational knowledge you must have Data Science Skills & Tools You Need in 2026.
Here are the main areas you should focus on:
- Statistics: This is about collecting, looking at, and understanding data. It helps you answer questions like "What’s the average spending of our customers?" or "Are these two groups really different, or is it just a fluke?" You’ll learn about things like averages, spread of data, and how certain events happen. This is super important for anyone aiming for roles in data analysis.
- Probability: This goes hand-in-hand with statistics. It’s about understanding chance and likelihood. If you want to predict something, like whether a customer will click on an ad, you’re dealing with probability. It helps you figure out how likely different outcomes are.
- Linear Algebra: This might sound a bit scary, but for data science, you just need the basics. It’s all about working with numbers arranged in grids or lists, which are called matrices and vectors. Many smart data modeling techniques and machine learning algorithms use linear algebra behind the scenes to crunch numbers very fast. You won’t usually be solving complex linear algebra problems by hand, but understanding the core ideas helps you grasp how these algorithms learn.
Learning Math and Statistics the Smart Way
Instead of diving deep into abstract math theories, think about learning these topics through practice. For someone starting data science from scratch, it’s much better to:
- Connect to Data: Learn statistics by actually working with datasets. Use Python or R to calculate averages, find trends, and test ideas. This hands-on approach makes it much clearer how these concepts apply to real-world problems.
- Focus on Application: Understand how a statistical test or a linear algebra concept is used in a data science problem, rather than just memorizing formulas. For example, learn how linear regression (a basic model) uses linear algebra to draw a line through data points.
- Use Online Analytics Courses: Many online platforms offer courses that combine math, statistics, and programming. These often come with practical exercises that help you build your skills step-by-step. Learning with applied examples is key to mastering these topics for immediate use. If you’re interested in building a career around this, exploring Master data careers advanced data engineering and science programs in 2026 could be a great next step.
For beginners, you don’t need to become a math professor. You need enough understanding to effectively use your tools, interpret your results, and know when something looks wrong. As you get more experience and dive deeper into data modeling, you can always go back and learn more of the advanced theory. The goal is to build a strong, practical foundation first.
After building a good foundation with math and statistics, the next big step in learning data science from scratch is getting your hands on real data. But here’s the thing: real-world data is rarely neat and tidy. It’s often messy, incomplete, and full of mistakes. This is where data wrangling, pipelines, and exploratory analysis come in.

Data Wrangling and Cleaning: Your First Mission
Before you can build cool models or find amazing insights, you have to clean your data. Think of it like washing vegetables before you cook them. This process is called data wrangling or data cleaning. It means checking your data for errors, missing pieces, and strange values, then fixing them. Experts say that defining clear data quality standards like accuracy, completeness, and consistency is vital for clean data 7 Essential Data Cleaning Best Practices – Monte Carlo Data.
Here are some practical steps for cleaning and validating your data:
- Find and fix missing data: Sometimes, parts of your data are just not there. You need to decide if you want to remove those rows or try to fill in the blanks using smart guesses.
- Remove duplicates: You might have the same information listed more than once. This can mess up your results, so it’s important to find and get rid of these extra copies.
- Correct errors and inconsistent formats: Data might have typos, or numbers might be stored as text, or dates might be in different styles. You’ll need to make everything uniform. For example, removing extra spaces or parsing unstructured text into a clear format can be helpful 5 Data Cleaning Techniques for High-Performing Pipelines – Fivetran.
- Validate your data: After cleaning, you need to check if your data makes sense. Do the numbers fall within expected ranges? Are there any values that are clearly wrong?
Building Data Pipelines for Smooth Work
To make sure your data cleaning steps are always done the same way and can be repeated, data scientists use something called a "data pipeline." A pipeline is like an assembly line for your data. It takes raw data and moves it through different stations in an organized way.
Common parts of a data pipeline include:
- Ingest: Bringing the raw data into your system.
- Transform: Cleaning and changing the data into a usable format.
- Validate: Checking the data for quality and correctness after cleaning.
- Store: Saving the cleaned and ready-to-use data for later analysis or data modeling.
A key idea here is "reproducible workflows." This means that anyone else, or even you in the future, can follow your steps and get the exact same results. The golden rule is to never change your original raw data. Instead, always make copies and do your cleaning steps on those copies. This way, you can always go back and see how you got your results A data cleaning pipeline for research projects. Documenting every step of your data cleaning and wrangling process is essential, especially when working on complex datasets Data Cleaning and Wrangling Guide: Best Practices.
Exploratory Data Analysis (EDA): Getting to Know Your Data
After cleaning, you’ll do Exploratory Data Analysis, or EDA. This is like getting to know your data. You’re looking for patterns, strange points (outliers), and relationships between different parts of your data. This helps you figure out the best way for data modeling later on and is a big part of what is data analytics.
For beginners, master these quick EDA checks and visualization patterns:
- Summary statistics: Get a quick overview of your numbers, like the average, the smallest, and the largest values.
- Spotting missing data: Look for where information is incomplete and understand why. Experts suggest to understand what type of data it is and look for missing data properly Eleven quick tips for data cleaning and feature engineering.
- Simple charts: These are your friends. Make bar charts for categories, histograms to see how numbers are spread, and scatter plots to check for links between two different numbers. These visualizations can quickly show you things that tables of numbers might hide.
Learning to master these practical steps is a crucial part of becoming a data scientist. If you’re looking to improve your skills in this area, you might want to learn more about how to accelerate your career with Python for data analysis in 2026.
Want to stay informed on the rapidly changing world of AI and technology, which often influences data science practices?
The AI Newsletter Worth Reading offers clear daily updates to keep you ahead.
After you’ve cleaned and explored your data, the next exciting step in learning data science from scratch is diving into machine learning. This is where your data starts to "learn" and make smart predictions or find hidden patterns. Think of it as teaching a computer to see things in your data that you might miss. It’s a big part of what helps businesses make smarter decisions, linking closely to the goals of data modeling and what is data analytics.
Intro to Machine Learning: Models, Evaluation, and Workflows
Machine learning, or ML, is how computers learn from data without being told exactly what to do. It’s like teaching a child by showing them many examples, instead of giving them a strict set of rules. This field has grown a lot, making it a key skill for anyone in data science in 2026.
Simple Kinds of Machine Learning
To start, it helps to think of machine learning in two main buckets:
- Supervised Learning: This is like learning with a teacher. You give the computer data that already has the "answers" or labels. The computer learns from these examples to predict answers for new, unseen data.
- Example: Showing a computer pictures of cats and dogs, with each picture clearly labeled "cat" or "dog." The computer learns to tell them apart. A common model here is Logistic Regression, which helps classify things into groups. Another is Linear Regression, used for guessing numbers, like house prices.
- Unsupervised Learning: This is more like learning by exploring. You give the computer data without any "answers." The computer then tries to find hidden patterns or groups within the data all by itself.
- Example: Giving the computer a list of customers and asking it to find groups of similar customers, without telling it beforehand what those groups should be. A popular model for this is K-Means, which helps find these natural clusters.
For beginners, learning core models like Linear Regression, Logistic Regression, Decision Trees, and K-Means is a great start. These are often recommended as essential models to know when getting started with machine learning. You can find many clear explanations, including video guides, to help you understand them better, like this overview of machine learning models.
How to Know if Your Model is Good: Evaluation Basics
Once you’ve trained a machine learning model, how do you know if it’s actually doing a good job? You need to test it!
- Train/Test Split: This is a key step. You take your cleaned data and split it into two parts:
- Training Data: This is what your model uses to learn.
- Testing Data: This is kept completely separate and is used to see how well your model performs on new data it has never seen before. It’s like giving a student a practice test and then a real test.
- Cross-Validation: Sometimes, a simple train/test split might not be enough. Cross-validation is a smarter way to test your model by splitting the data into many different training and testing sets. This helps you get a more reliable idea of how well your model will work in the real world.
- Simple Metrics: After testing, you look at scores called "metrics."
- For models that guess numbers (like house prices), you might look at how close the guesses were to the actual numbers.
- For models that put things into groups (like cat or dog), you might look at "accuracy," which is how often the model guessed correctly. Accuracy is often the first metric people check, though there are others like precision and recall that give a deeper picture of how well a model classifies data 8 Machine Learning Models Explained in 20 Minutes.
Your First Machine Learning Projects
The best way to learn machine learning from scratch is by doing. Here are some simple project ideas to get started:
- Predicting Sales: Use past sales data (like advertising spend, time of year) to predict how much a store might sell next month. This is a great way to use Linear Regression.
- Classifying Emails: Build a model to tell if an email is "spam" or "not spam" based on its words. This is a classic problem for Logistic Regression or Decision Trees.
- Customer Grouping: Take customer data (like how much they spend, what they buy) and use K-Means to find different types of customers without giving the model any pre-set groups.
Choosing the right tools for your projects and defining your problem clearly are important first steps in machine learning, just like in any part of the data science process. These practical projects will help you understand the core concepts and workflows. If you’re looking for more guidance on advancing your skills, consider exploring advanced data engineering and science programs in 2026.
The projects we just talked about are perfect for understanding how data science works. Now, let’s look at how you can turn these learnings into real skills and show them off to the world. This is super important if you’re serious about learning data science from scratch and landing a job.
Projects, portfolios, and next steps: build real skills
Getting hands-on with projects is the best way to truly learn data science. You want to pick project ideas that let you try out every step of the data science journey, from getting your data all the way to telling a story with what you find. Think about projects that tackle simple, everyday problems. For instance, predicting house prices is a classic starting point because it lets you show off skills like cleaning data, making predictions, and explaining your results clearly, covering the whole workflow from start to finish. Finding beginner-friendly projects helps you build a strong foundation, as many data science syllabuses in 2026 suggest focusing on practical application from the start Data Science Syllabus 2026: Full Module Breakdown. You can also find many ideas for simple projects, including video guides on Building Your Best Data Science Portfolio.
Making Your Projects Shine in a Portfolio
Your projects are more than just practice; they become your "portfolio."

This is like a showcase of your best work that you show to future employers. To make your portfolio stand out, each project needs a clear story. Here’s how to structure a great portfolio entry:
- Problem Statement: What real-world problem were you trying to solve? Keep it simple.
- Approach: How did you try to solve it? What data did you use? What methods did you follow? For example, did you use Python for data analysis?
- Results: What did you find or predict? What did your models tell you? Make sure your findings are easy to understand.
- Reproducible Code: Share your code! This shows you can write clean, working code that others can understand and run. Many experts agree that well-documented projects that show problem-solving skills are key 9 Data Science Portfolio Projects for Data Scientists:2025 Edition. Showing end-to-end projects is especially helpful, according to many data science professionals Build Data Science Portfolio — Projects That Get Hired.
Your Next Steps: Growing and Getting Hired
Once you have a few solid projects, it’s time to think about your next steps.
- Join Communities: Connect with other data scientists. Online groups, local meetups, and forums are great places to ask questions, share ideas, and find mentors. Learning from others can fast-track your skills, especially for things like accelerate your career with Python for data analysis in 2026.
- Seek Mentorship: A mentor can offer guidance and help you avoid common mistakes. Many experienced data scientists are happy to help beginners.
- Present Your Work: Practice talking about your projects. Explain your problem, how you solved it, and what you learned. This skill is crucial for job interviews. When you’re ready to look for jobs, understanding mastering AI jobs 2026 discover top roles in demand skills and high salaries can give you a big advantage.
- Keep Learning: Data science changes fast. Stay curious! Read up on new tools, methods, and trends. Many online analytics courses can help you stay current.
By doing real projects, building a great portfolio, and connecting with the data science community, you’ll be well on your way to a successful career in 2026.
Ready to stay updated with all the latest in AI and technology? Get clear daily AI updates from The AI Newsletter Worth Reading.
Summary
This article offers a concise, practical roadmap for learning data science from scratch, aimed at busy professionals who feel overwhelmed by the field. It explains core topics—programming (Python and R), essential libraries, SQL, statistics, linear algebra, data cleaning, EDA, and an intro to machine learning—while addressing common beginner hurdles like math gaps, tool choice, and project selection. The guide lays out the typical data science workflow from problem definition through data gathering, cleaning, modeling, evaluation, and deployment, and shows how to structure beginner projects to build a portfolio. It stresses hands-on learning with reproducible pipelines, simple evaluation methods, and starter models (linear/logistic regression, decision trees, k-means). The article also covers career paths (data analyst, engineer, ML engineer) and practical next steps—joining communities, seeking mentors, and keeping skills current. After reading, you’ll have a clear learning sequence, the tools to start projects, and the confidence to build a portfolio that supports job transitions in 2026.