
In 2026, many businesses find themselves swimming in a sea of information. They have lots of data from sales, customers, and daily operations. But having a lot of data doesn’t always mean knowing what to do next. It’s like having a huge map but no compass to tell you which way to go. This often leads to decision overload, making it hard to choose the best path forward.

This is where prescriptive analytics comes in. It’s the most advanced type of data analysis. While other types of analysis tell you what happened or what might happen, prescriptive analytics goes a step further. It tells you what you should do to get the best results. It gives clear recommendations for actions to take, helping businesses solve problems and grab new chances. Understanding the true data meaning from all this information is key.
This guide will give you a clear and expert look at prescriptive analytics. We will break down important data ideas and explain the differences between how data is stored and used. You’ll learn about the good and bad sides of putting these systems into action. Most importantly, we’ll show you the real impact prescriptive analytics can have on your business, helping you make smarter choices and grow.
To keep up with all the new ideas in AI and data, you need trusted sources. Get clear daily AI updates from The AI Newsletter Worth Reading.
What is prescriptive analytics? Definitions, scope, and where it fits
Prescriptive analytics is the top level of data analysis, going beyond simply understanding what has happened or predicting what might happen. It’s about getting clear advice on the best steps to take. Think of it as having a smart assistant who not only shows you the map of where you’ve been and where you’re going, but also tells you the exact turn to make for the smoothest journey.

This advanced approach helps businesses move past guessing and make truly informed decisions.
To understand prescriptive analytics better, let’s see how it differs from its siblings in the world of data:
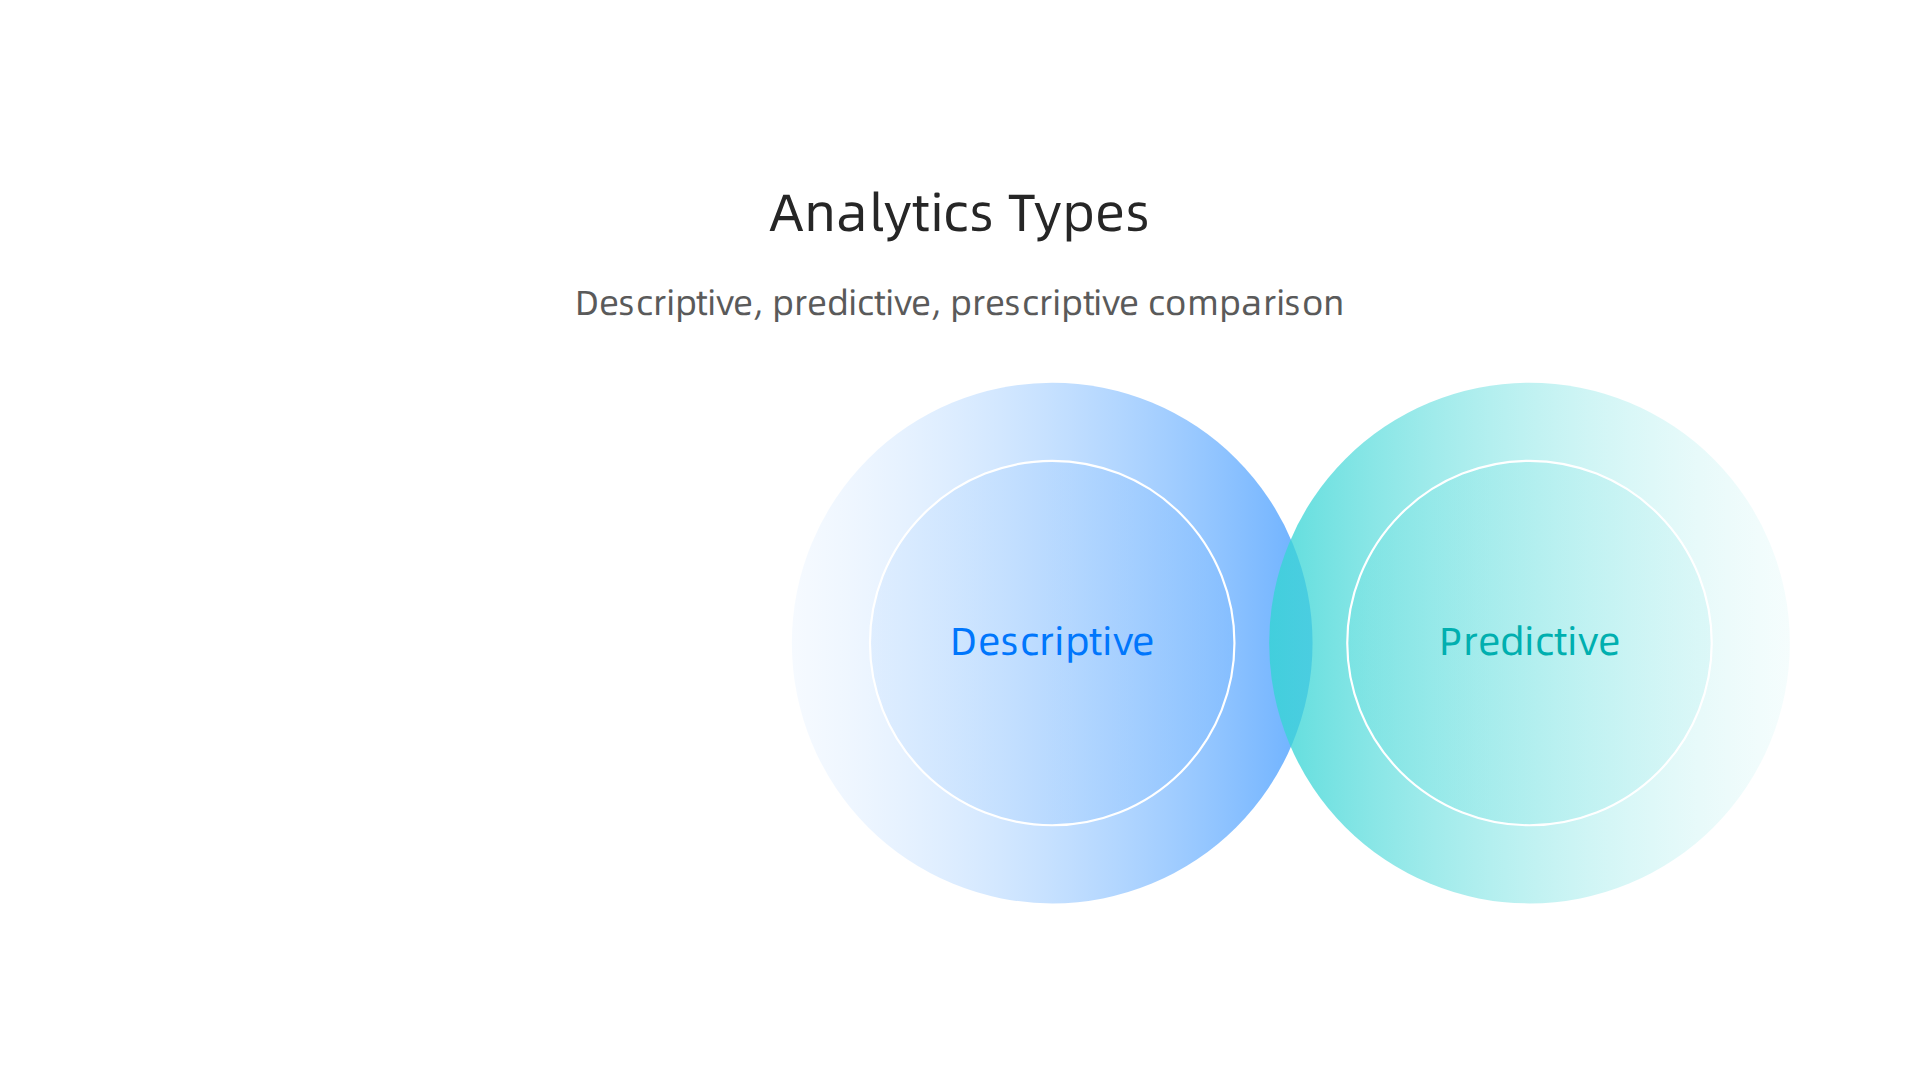
- Descriptive Analytics: This answers "What happened?" It looks at past data to describe events. For example, a report showing last month’s sales numbers.
- Predictive Analytics: This asks "What will happen?" It uses past data patterns to forecast future outcomes. An example would be predicting next month’s sales based on past trends.
- Prescriptive Analytics: This takes it a step further by asking "What should we do?" It gives specific recommendations to guide choices and reach certain goals. This is the most complex type of data analysis because it does not just tell you what could happen, but tells you what action to take What Is Prescriptive Analytics?.
At its heart, prescriptive analytics works by using a clear structure or "taxonomy" to turn raw information into useful advice. Here’s how it generally works:
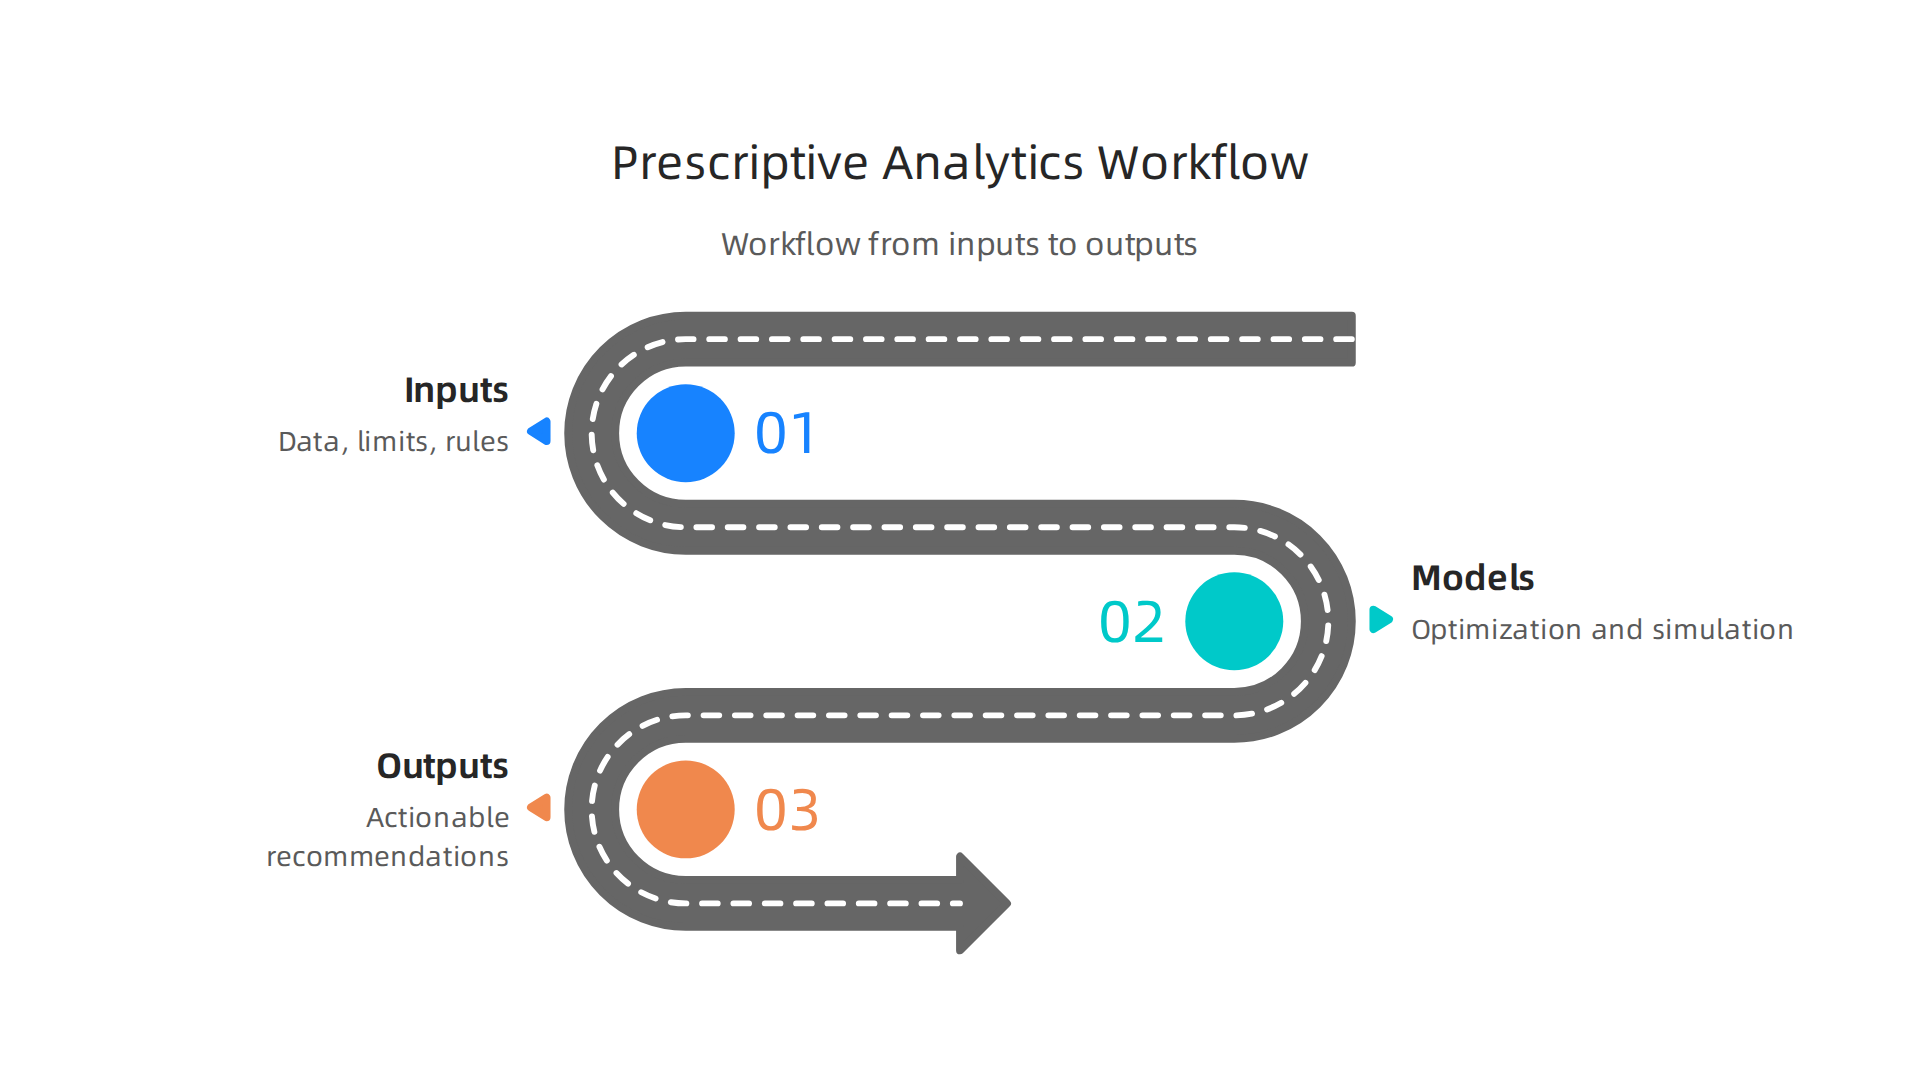
- Inputs: The system first needs good information. This includes all kinds of data, like past sales, customer behavior, and how products are made. It also needs to know about any limits or rules, such as your budget, how many people you have, or specific company policies. The quality of this data is key for getting meaningful recommendations. Sometimes, gathering and sorting this data might involve thinking about the differences between a data warehouse and a data lake.
- Models: Once the inputs are ready, prescriptive analytics uses smart computer models. These models often involve:
- Optimization: This is like finding the best possible solution among many choices. For example, figuring out the fastest delivery route or the most cost-effective way to make a product.
- Simulation: This lets the system test out different actions in a fake environment to see what might happen without risking real-world problems. It helps understand the possible outcomes of various choices. These advanced models are central to its power to recommend actions A Formal Paradigm for Auditing Human Decisions Under….
- Outputs: The final step is getting clear, actionable recommendations. These are not just predictions; they are direct instructions or strategies for what a business should do to reach its goals. For instance, a prescriptive analytics system might recommend: "Increase marketing spending on social media by 15% next quarter to boost sales of product X."
Businesses in 2026 are finding that understanding this kind of data analysis is crucial. By truly grasping the data meaning and applying prescriptive analytics, companies can solve tricky problems and find new chances to grow. Many professionals who work with data use tools like Python for data analysis to build and manage these kinds of systems. It helps them make smarter choices and reach their business goals more effectively. If you’re looking to dive deeper into this field, learning more about data careers can be a great next step.
Key components and typical workflow for prescriptive systems
Going deeper into how prescriptive analytics actually works, we can look at its key parts and the steps it takes. It’s not just about having smart models; it starts with getting the right data ready.
Data Preparation for Smart Decisions
The journey of prescriptive analytics begins with data. Before any smart models can give advice, they need good, clean information. This first step is called data ingestion and feature preparation. It means gathering all sorts of data from different places and making it useful for the system.
Imagine you’re trying to figure out the best way to deliver packages. You’d need data on past deliveries, road conditions, traffic patterns, and even weather. This raw data needs to be cleaned up and organized. Sometimes, this involves deciding where to store your data, whether in a data warehouse or a data lake. The goal is to create "features" or specific pieces of information that the models can understand and learn from. This step is super important because even the smartest models can’t give good advice if the data meaning is unclear or faulty.
Choosing the Right Tools and Models
Once the data is ready, the prescriptive system chooses the best ways to analyze it and make recommendations. This is where model selection and decision orchestration come in. We talked about optimization and simulation before. In 2026, many prescriptive analytics tools use these and other advanced methods to suggest actions. For example, a good tool should have strong optimization algorithms and ways to simulate different situations to test ideas 10 Best Prescriptive Analytics Tools 2026.
One powerful type of model that’s increasingly used is Reinforcement Learning (RL). Think of RL as teaching a computer to make choices through trial and error, like how a person learns from their experiences. The system tries different actions, gets feedback (rewards or penalties), and then learns which actions lead to the best results over time. This makes it really good for solving problems where decisions happen one after another, like planning fishing routes or managing complex supply chains Data-Driven Prescriptive Analytics Applications: A Comprehensive Survey. Many research papers in 2025 and 2026 highlight how useful reinforcement learning is for creating automatic prescriptive analytics systems because it doesn’t need someone to label all the data beforehand Demystifying Prescriptive Analytics Frameworks and ….
These models, whether they are focused on optimization, simulation, or reinforcement learning, work together to "orchestrate" decisions. This means they don’t just give a single piece of advice; they help put together a whole plan of action that takes into account all the different factors and goals. Businesses rely on skilled data specialists are more critical than ever in the age of AI to build and manage these complex systems, ensuring they deliver the most effective recommendations.
How prescriptive analytics differs from descriptive and predictive analytics
Now that we understand how prescriptive analytics works, it’s helpful to see how it’s different from other types of data analysis. Think of analytics as steps on a ladder. Each step helps businesses understand more and make better choices. There are three main kinds: descriptive, predictive, and prescriptive.
What Happened? Descriptive Analytics
Descriptive analytics is the first step. It simply tells you "what happened." This type of analysis looks at past data to summarize and explain events. For example, a report showing how many products were sold last month or a chart showing website visitors yesterday are examples of descriptive analytics. It’s about monitoring current and past situations, often through dashboards and reports. This kind of analysis helps you see trends and understand your business’s history.
What Might Happen? Predictive Analytics
Moving up the ladder, predictive analytics asks "what might happen?" This step uses past data to make forecasts or guesses about the future. For instance, it can predict how many sales a company might make next quarter or which customers are likely to leave. Predictive models learn from historical patterns to tell you about future possibilities. The market for predictive analytics is quite big, growing to be valued at an estimated USD 27.56 billion in 2026, and it’s set to keep growing fast Predictive Analytics Market Size, Share | Industry Report …. These systems are good at spotting future problems or chances, but they don’t tell you what to do about them.
What Should We Do? Prescriptive Analytics
This brings us to prescriptive analytics, the highest step on the ladder. It answers the question, "what should we do?" This type of analytics doesn’t just show what happened or what will happen. It suggests specific actions to take to get the best outcome. It tells you how to make something happen or how to avoid a problem. For example, instead of just predicting that sales will drop, prescriptive analytics might suggest changing prices or launching a new ad campaign to boost sales. The goal of prescriptive analytics is to guide decisions and actions, which is why businesses are investing in it heavily. The global prescriptive analytics market, for instance, is projected to reach $13.43 billion in 2026 Prescriptive Analytics Global Market Report 2026. This growth shows how much companies want systems that not only give insights but also recommend actions.
Differences in Data Needs
Each type of analytics also needs different kinds of data and ways to use it.
- Descriptive analytics often needs historical data that’s already clean and organized. The focus is on showing the data meaning clearly.
- Predictive analytics needs good quality historical data too, but it also cares about getting new data quickly to make accurate forecasts. Missing data can really hurt its ability to guess the future.
- Prescriptive analytics needs the most advanced data setup. It requires very fresh, accurate data in real-time. The quality of the data is super important because bad data will lead to bad recommendations. It also needs to be easily connected to systems that can actually do something with the advice, like changing prices in a system or updating a shipping route. This is where mastering data skills, including python for data analysis in 2026, becomes very useful for preparing and handling such complex data.
In short, descriptive analytics looks back, predictive analytics looks forward, and prescriptive analytics looks forward with advice on what to do.
Prescriptive analytics shines brightly in many parts of business, offering clear paths to better results.

Let’s look at how different industries use it to make smart moves.
Use cases by industry: operations, pricing, healthcare, and marketing
This type of analytics goes beyond just seeing what is happening or what might happen. It gives specific advice on what actions to take to reach a goal. This makes it very useful across many fields.
-
Operations: In manufacturing, prescriptive analytics helps companies make their supply chains work better and produce things more efficiently. It can suggest how much material to order, when to schedule production, or which delivery routes are best. For example, if a machine is likely to break down, the system might suggest doing maintenance before it fails. This helps avoid costly stops and keeps things running smoothly. Many manufacturing companies use prescriptive analytics to improve how they make and deliver products Prescriptive Analytics Market Size Report, 2026-2033.
-
Pricing: Businesses often use prescriptive analytics to set the best prices. It can look at things like customer demand, competitor prices, and inventory levels. Then, it recommends exactly how to change prices to make the most money or sell the most items. This can be very complex, but prescriptive systems help cut through the data meaning to find the sweet spot.
-
Healthcare: In healthcare, prescriptive analytics can greatly improve patient care. It might suggest the best treatment plan for a patient based on their specific health data and past successful cases. It can also help hospitals manage beds and staff better. A leading healthcare provider used this kind of analytics to improve patient care, which led to fewer hospital readmissions and lower costs Mastering Prescriptive Analytics for Business. This shows how it can help save lives and resources.
-
Marketing: For marketing teams, prescriptive analytics can create very personalized customer experiences. It can tell a company exactly which ads to show a customer, what product to recommend, or when to send an email for the best chance of a sale. This is like having a smart assistant tell you how to reach each customer in the most effective way, leading to more sales and happier customers. These insights can also feed into a broader strategy to unlock maximum business value with strategic AI adoption.
When using prescriptive analytics, companies also need to think about specific rules. For instance, in healthcare, patient safety and privacy are very important. In transportation, safety and delivery times (Service Level Agreements) are key. The system’s recommendations must always follow these important rules and laws.
For prescriptive analytics to give truly smart advice, it needs the right kind of fuel: good data. Just like a chef needs fresh ingredients for a great meal, a prescriptive system needs high-quality data to make the best recommendations. It’s not just about having a lot of data, but having the right kind, in the right way.
Core data concepts and requirements for prescriptive analytics
At its heart, prescriptive analytics helps answer "what should we do?" and "why?" to reach a goal A Research Review and Taxonomy Development for Decision Support and Business Analytics Using Semantic Text Mining. To do this, it relies on several key data ideas:
-
Data Types: Prescriptive analytics uses many types of information. It looks at historical data to learn from the past, like what happened when prices were changed. It also needs real-time data to understand what is happening right now, such as how many items are in stock or how many customers are on a website. Sometimes, it even pulls in external data, like weather forecasts or news, if those things affect a business.
-
Granularity: This big word just means how detailed the data is. For prescriptive analytics, the data needs to be detailed enough to see important small patterns, but not so detailed that it becomes too hard to manage. For example, knowing what each customer bought is more useful than just knowing how much money the store made overall. This deep dive into the numbers helps give clear data meaning.
-
Latency: This refers to how quickly new data arrives and is ready to be used. For some decisions, like how to reroute delivery trucks during a traffic jam, data needs to be almost instant (low latency). For other decisions, like planning next year’s budget, data can come in slower. The right speed of data is very important.
-
Causal and Counterfactual Data: This is a fancy way of saying we need to understand why things happen and what would happen if we did something different. Prescriptive analytics isn’t just predicting what will happen; it’s suggesting what to do. To do this well, it needs data that shows cause and effect. For example, if a company changed its ad strategy, did sales go up because of the ads (causal), or would sales have gone up anyway? This kind of data helps systems truly understand choices. Knowing what might happen if a different choice were made, called a counterfactual outcome, is crucial for good recommendations Prescribing Decisions Using AI-Based Prescriptive Analytics.
Making Sure the Data is Good
Good data means good advice. Prescriptive analytics needs data that is:
-
High Quality: The data must be correct and complete. Imagine trying to give directions with a faulty map; you would get lost. Similarly, dirty or missing data can lead to bad recommendations. Ensuring data consistency and accuracy is a core requirement PRESCRIPTIVE ANALYTICS IN.
-
Well Labeled: For the smart computer programs (like machine learning models) that power prescriptive analytics, data often needs to be labeled. This means telling the computer what each piece of data represents. For instance, clearly marking customer complaints versus positive feedback helps the system learn what makes customers happy or upset. Learning about things like data annotation specialist critical for AI accuracy and data quality can help a lot here.
-
Synthetic or Simulation Data: Sometimes, you can’t just try out every idea in the real world. What if changing a treatment plan for a patient has risks? Or what if a new pricing strategy might lose money? This is where synthetic data (data created by computers that looks like real data) and simulation come in. You can use this fake data to run "what-if" tests and see how different choices might play out without any real risk. This is like practicing a play without actually performing it for an audience, helping to find the best moves. These "what-if" simulators help find optimal solutions before real-world deployment 3 Prima-Causa.
Tools for handling all this data, such as those used in accelerate your career with Python for data analysis in 2026, are becoming more and more important. Understanding these data requirements is the first step toward getting useful advice from prescriptive analytics systems.
Staying on top of the latest advancements in data and AI can feel like a full-time job. For clear, daily insights, consider subscribing to The AI Newsletter Worth Reading.
After gathering all that valuable data, the next important step is to make it useful. This is where smart computer programs, called algorithms and models, come into play. They are like the "brains" behind prescriptive analytics, taking all the data and figuring out the best actions to take. They don’t just tell you what happened or what might happen; they tell you what should happen.
Prescriptive analytics uses different kinds of smart thinking tools:
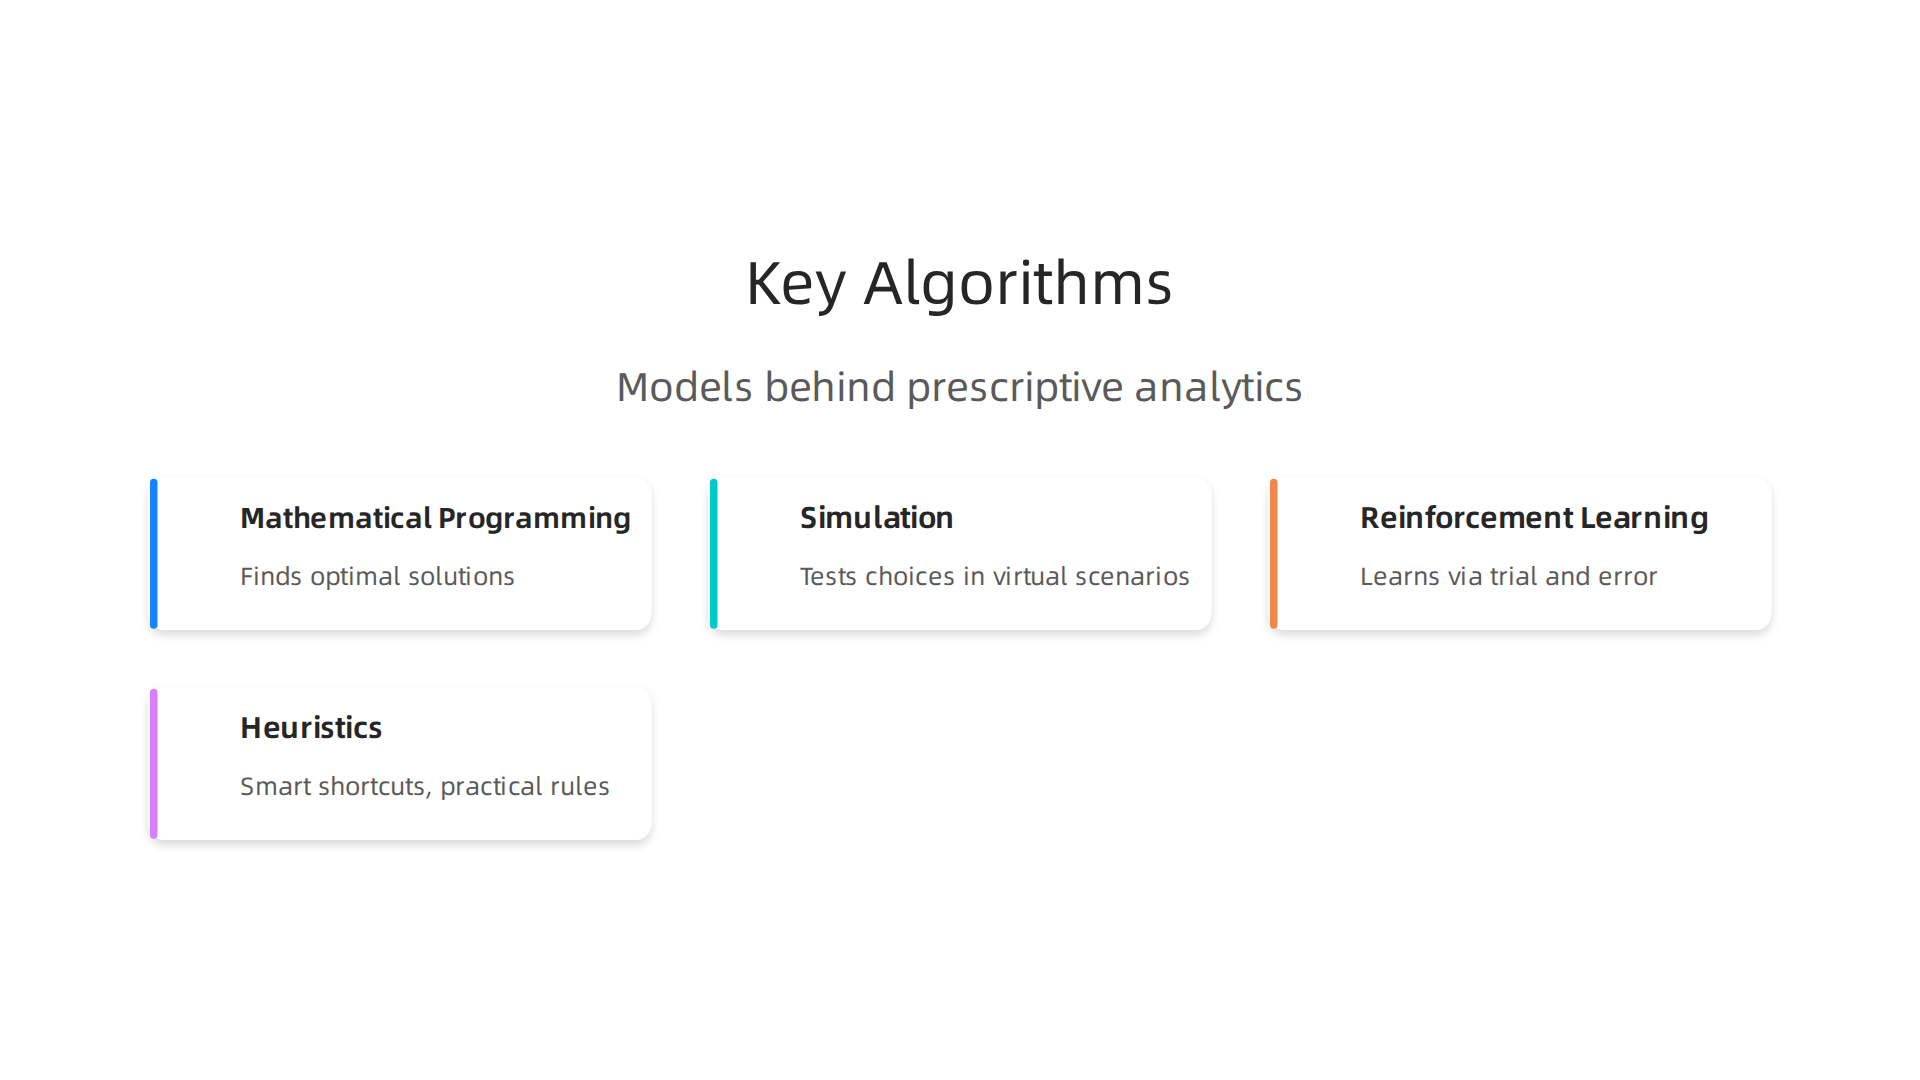
Mathematical Programming (Optimization)
Think of mathematical programming as finding the absolute best way to do something. It’s like having a recipe for a cake and wanting to find the perfect mix of ingredients and baking time to make the tastiest cake possible, using the least amount of sugar. Businesses use this to solve problems where there’s a clear goal, like making the most profit, spending the least money, or delivering goods on the shortest route. These tools are key to prescriptive analytics and use smart math to find the very best solution 10 Best Prescriptive Analytics Tools 2026 | Expert Review.
Simulation
Sometimes, you can’t try out every idea in the real world because it might be too risky or too expensive. That’s where simulation comes in handy. It’s like building a pretend world on a computer where you can test different choices to see what might happen without any real danger. You can run "what-if" scenarios, like seeing what happens to customer wait times if you add more staff, or how a new product line might sell. Simulation is a popular method that helps find optimal solutions before trying them out in real life Impacts of Artificial Intelligence Applications on Prescriptive ….
Reinforcement Learning
Imagine teaching a computer program how to play a game. At first, it might not know what to do. But every time it makes a good move, it gets a "reward." If it makes a bad move, it learns not to do that again. This is called reinforcement learning. The program learns by trying things out and getting feedback, getting better over time at making decisions to reach a goal. This approach is very useful for automatic prescriptive analytics because it doesn’t need someone to label all the data beforehand Demystifying Prescriptive Analytics Frameworks and ….
Heuristics
Sometimes, a problem is so big or complex that finding the absolute perfect answer would take too long. That’s when we use heuristics. These are like smart shortcuts or good rules of thumb that help us find a very good answer quickly, even if it’s not always the absolute best. For example, a delivery driver might use a heuristic like "always take the biggest roads" to get to a new town quickly, even if there might be a slightly faster back road they don’t know about. These methods help make decisions in tricky situations Simulation-based generation of heuristics for decision-making in stochastic environments.
Important Considerations for These Tools
When using these algorithms for prescriptive analytics, businesses also think about a few key things:
- Scalability: Can the algorithm handle a small problem, or can it work with tons of data and millions of choices for a very big company?
- Interpretability: Can we understand why the algorithm made a certain suggestion? It’s easier to trust and use advice if you know the reasons behind it. Learning about artificial intelligence basics can help business leaders grasp these concepts better.
- Robustness: What if the data isn’t perfect, or things change a little in the real world? A good algorithm gives useful advice even when things aren’t exactly as expected.
Understanding these different ways that computers think and solve problems is vital for anyone looking to use prescriptive analytics effectively in 2026. Knowing what each method does best helps us choose the right tool for the job. For those looking to advance their knowledge in this area, exploring resources on mastering AI in 2026 can be very beneficial.
Even with the smartest computer programs, putting prescriptive analytics to work isn’t always a walk in the park. There are important things to think about and challenges to overcome to make sure these tools are used well and safely.

This is especially true in 2026, as more and more businesses rely on smart computer systems for big decisions.
Making Sure AI Decisions Are Good and Safe (Governance)
When prescriptive analytics tools suggest actions, especially for important business choices, we need ways to make sure those suggestions are good and fair. This is called "governance." Think of it as having rules and checks in place to keep everything running smoothly and correctly.
Here’s what good governance involves:
- Validation: This means checking that the computer program’s advice actually works and is based on correct information. We need to test it again and again to be sure.
- Auditability: It’s important to be able to look back and understand why the system made a certain recommendation. If something goes wrong, we need to trace its steps. Having a clear record, like an audit trail, helps a lot AI Governance Auditing: Prepare for Your First AI Audit.
- Safety Checks and Control Loops: For automated decisions, we need safety nets. What if the system makes a choice that could cause harm? There should be ways for humans to step in and fix things. This is especially important for systems that learn on their own. New standards, like ISO/IEC 42001:2023 – A new standard for AI governance, help businesses set up strong ways to manage their AI systems responsibly.
Also, we need to think about ethics. These powerful tools can sometimes have unfair biases or affect people’s privacy. Understanding The Real Dangers of AI in 2026: Bias, Privacy, Job Loss, and Existential Risk is key to using prescriptive analytics responsibly.
Dealing with Company Roadblocks
Beyond the tech stuff, there are also challenges within a company when bringing in prescriptive analytics:
- Data Ownership: Who is in charge of the data? Different teams might collect different kinds of data, and sometimes they need to share it. Everyone needs to agree on what the data means and how it should be used. Clear rules about data meaning are essential.
- Cross-Functional Workflows: Prescriptive analytics often means different parts of a company, like sales, marketing, and operations, have to work together in new ways. This can change how people do their jobs and how tasks flow between teams.
- Change Management: People naturally resist change. Introducing new tools like prescriptive analytics means some jobs might change, or people might need new skills. It’s crucial to help employees understand why these changes are happening and how the new tools will make their work better. Training and clear communication can help everyone get on board.
Overcoming these challenges is crucial for any company wanting to truly benefit from prescriptive analytics. It’s not just about the technology; it’s also about how people and processes adapt.
Stay ahead with clear, daily insights into the world of AI. Get up to speed with breaking developments and expert analysis.
The AI Newsletter Worth Reading
After a company gets its prescriptive analytics tools up and running, and deals with all the challenges like making sure the AI is fair and getting everyone on board, the next big question is: "Is it actually working?" It’s super important to know if these smart systems are truly helping the business make more money or save costs. Measuring the impact of prescriptive analytics shows if all the hard work is worth it.
How to Know if Prescriptive Analytics is Working
To understand if prescriptive analytics is making a real difference, businesses look at key numbers called Key Performance Indicators, or KPIs. These KPIs help them see how well the system’s advice is being used and what good things happen because of it.
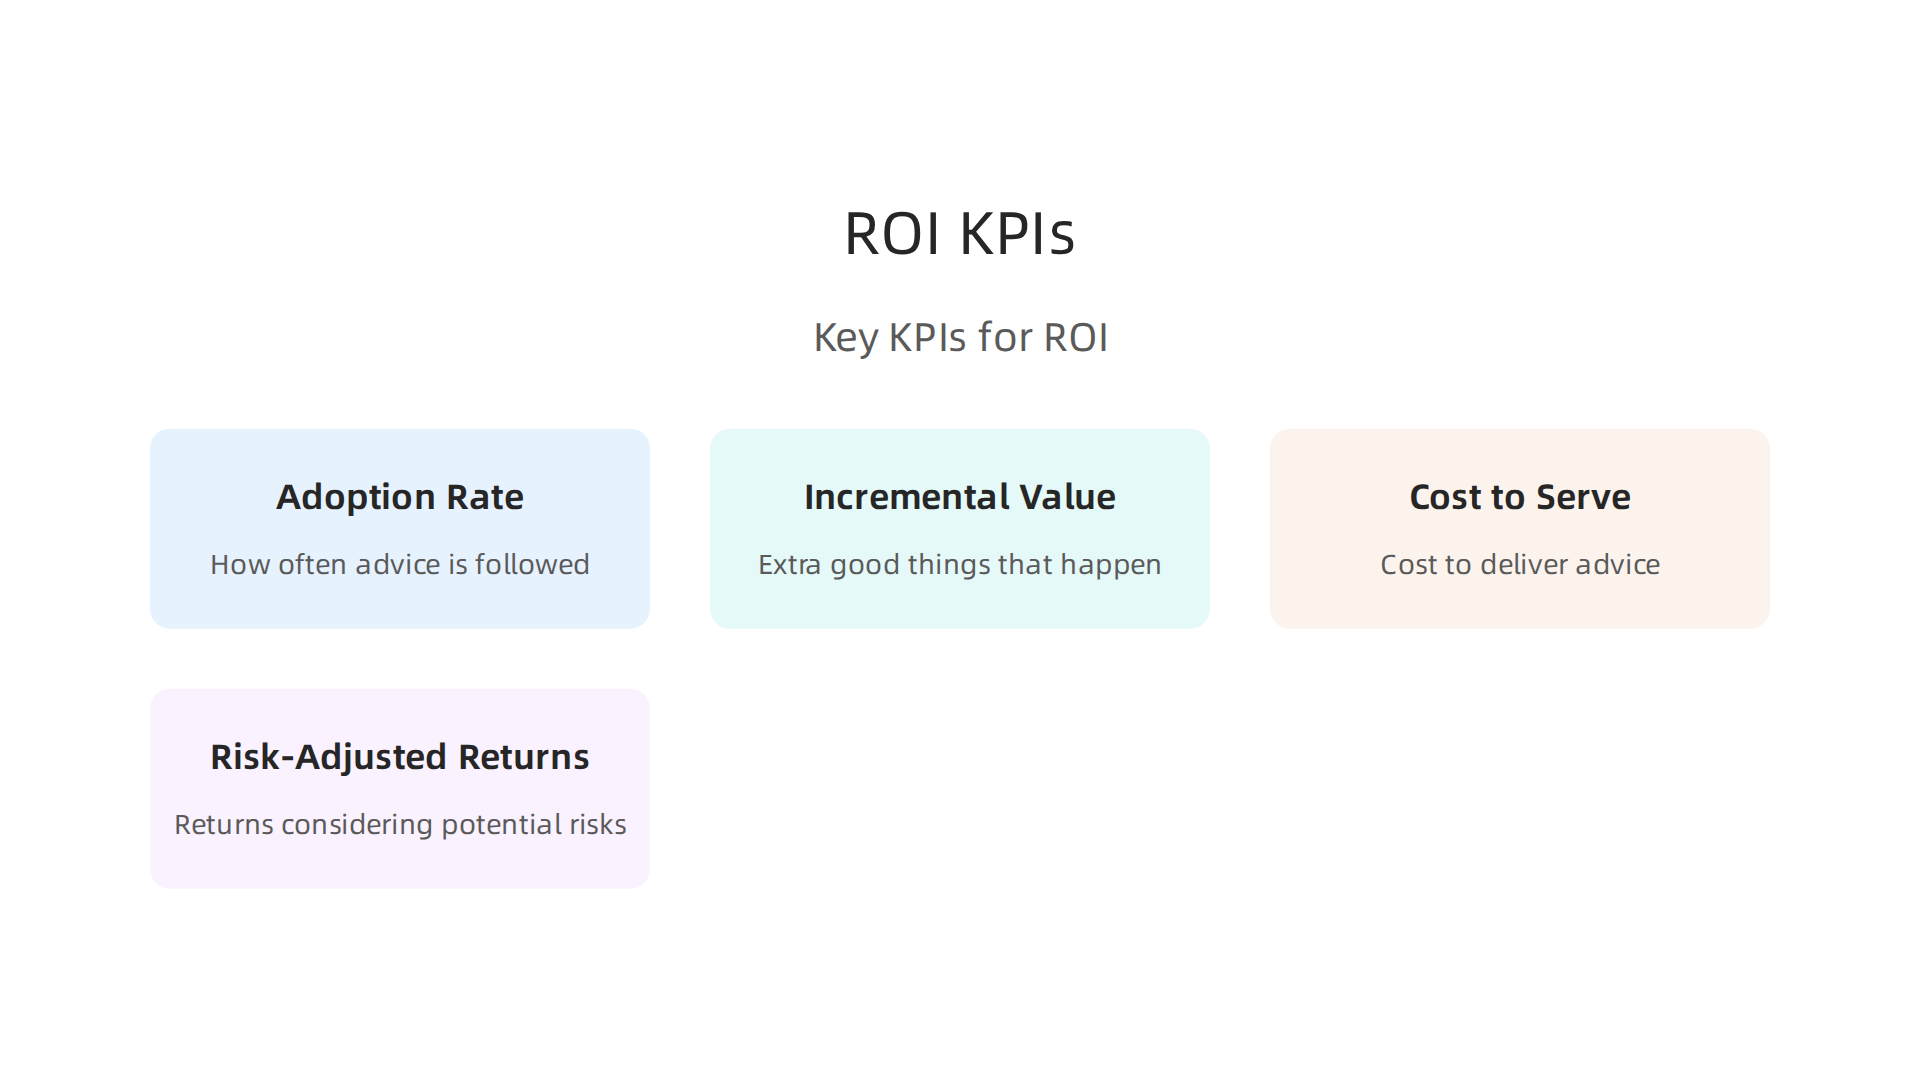
Here are some important KPIs:
- Action Adoption Rates: This simply means how often people actually follow the advice given by the prescriptive analytics system. If the system suggests "do X," how many times do people actually "do X"? If people aren’t using the advice, then the system isn’t helping.
- Incremental Value: This measures the extra good things (like more sales or lower costs) that happen because of the prescriptive analytics. It’s about finding the difference between what happened with the advice and what would have happened without it. It shows the real benefit added by the system.
- Cost-to-Serve: Prescriptive analytics isn’t free. There are costs to build and run these systems. This KPI helps a business understand how much it costs to provide each piece of advice or to get a certain outcome. This is especially important for large datasets or complex models where the cost of computing for deep data analysis can add up.
- Risk-Adjusted Returns: Sometimes, taking action has risks. This KPI looks at how much money is gained (or saved) after taking into account any potential downsides or risks involved. It helps a business make smarter decisions that don’t just chase big gains but also consider safety.
These measurements are vital for tracking progress toward business goals and showing the value of using advanced analytics University of Padua. Many companies that use predictive and prescriptive analytics see much better returns on their investments compared to those that only use simpler data analysis Measuring ROI of data and analytics programs.
Smart Ways to Test Prescriptive Analytics
Just like you’d test a new recipe, you need good ways to test if the advice from prescriptive analytics really works. Here are some common methods:
- A/B Testing for Decisions: This is like trying two different versions of something to see which one performs better. For prescriptive analytics, it means the system suggests two different actions, and you try each action with a separate group to see which one gives the best result. For example, a business might test two different marketing messages that the system suggested. In 2026, many companies see significant conversion rate increases from systematic A/B testing A/B Testing Statistics for 2026: Market Size, Adoption Rates.
- Counterfactual Evaluation: This is a fancy way of saying "what if." You look at a decision the system suggested and compare what actually happened to what might have happened if a different choice was made. This helps understand the true impact of the system’s recommendation, especially when you can’t run a perfect A/B test Prescribing Decisions Using AI-Based Prescriptive Analytics.
- Offline Simulators: Imagine a fake, digital world where you can try out different ideas without any real-world risk. Offline simulators do exactly this. They use data to create a virtual environment where you can test the prescriptive analytics system’s recommendations again and again to see what outcomes they would likely lead to. This helps fine-tune the system before it makes real decisions.
By using these methods, businesses can confidently say that their prescriptive analytics systems are not just making suggestions, but actually driving better outcomes. Learning how to master the types of AI that power these systems, and ensuring proper testing, can truly unlock business value. If you’re looking to enhance your understanding of how AI is shaping today’s business landscape and make informed strategic decisions, you need reliable, up-to-date information.
Stay ahead with clear, daily insights into the world of AI. Get up to speed with breaking developments and expert analysis. The AI Newsletter Worth Reading
Summary
Prescriptive analytics is the most advanced layer of data analysis that goes beyond describing past events or forecasting the future: it recommends specific actions to achieve business goals. This article explains how prescriptive systems work—from gathering and preparing high‑quality inputs to choosing models (optimization, simulation, reinforcement learning, heuristics) and delivering actionable outputs—and why each step matters. It covers the data requirements (granularity, latency, causal evidence), the main algorithms, and practical industry use cases across operations, pricing, healthcare, and marketing. The guide also addresses real-world obstacles such as governance, ethics, data ownership, and change management, and shows how to test and measure value with KPIs like adoption rate, incremental value, cost‑to‑serve, and risk‑adjusted returns. Readers will learn what teams, tools, and skills are needed to deploy prescriptive analytics responsibly and how to validate that the system is driving measurable business impact.